← Back to Articles
Published on 12-Oct-2025

Moving Average Trading: SMA, EMA & Crossover Strategies for Indian Stocks

Master moving average trading with SMA, EMA, and crossover strategies for Indian stocks. Learn golden cross, death cross, and 50/200 DMA strategies using NSE and BSE stocks.

By Zomefy Research Team
15 min read
technical-indicatorsBeginner

Moving Average Trading: SMA, EMA & Crossover Strategies for Indian Stocks

moving averagesSMA EMAgolden cross
Reading time: 15 minutes
Level: Beginner
Category: TECHNICAL INDICATORS

What You Can Do Next

  • Read the full article for complete insights
  • Save for later reference
  • Share with others learning about this topic

Image not available

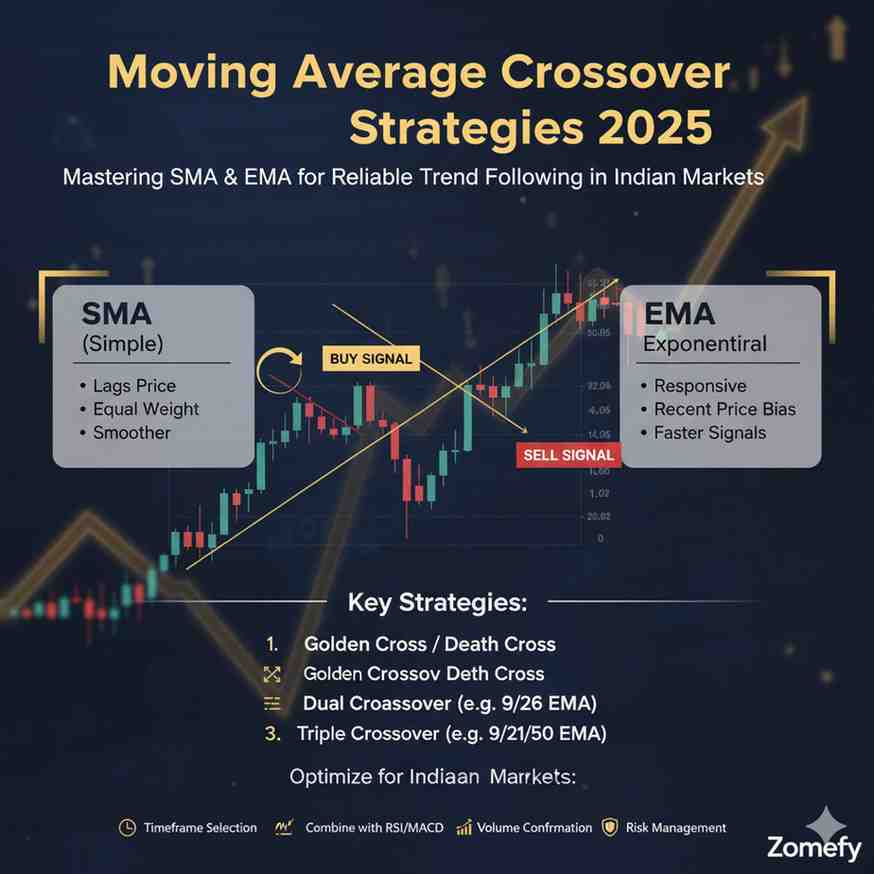
Moving averages are among the most fundamental and widely used technical indicators in trading. They smooth out price data to identify trends and provide dynamic support and resistance levels. In Indian markets, moving averages are particularly effective due to the trending nature of NSE and BSE stocks. This comprehensive guide covers Simple Moving Averages (SMA), Exponential Moving Averages (EMA), crossover strategies, and advanced techniques specifically tailored for Indian market conditions.

Understanding Moving Averages

Moving averages are calculated by averaging a specified number of past prices over a given period.
Simple Moving Average (SMA)**::
Equal weight to all prices in the period.
Exponential Moving Average (EMA)**::
More weight to recent prices.
Purpose**::
Smooth price data, identify trends, provide support/resistance.
Indian Context**::
Moving averages work well with trending Indian stocks and Nifty 50.

Simple Moving Average (SMA)

Calculation**::
Sum of closing prices divided by number of periods.
Characteristics**::
Equal weight to all prices, smoother than EMA.
Common Periods**::
20, 50, 100, 200 days.
Trading Application**::
Use for trend identification and support/resistance.
Indian Examples**::
Nifty 50 200-day SMA at 18,500-19,000 often acts as major support.

Exponential Moving Average (EMA)

Calculation**::
More weight to recent prices, less to older prices.
Characteristics**::
More responsive to price changes than SMA.
Common Periods**::
12, 26, 50, 200 days.
Trading Application**::
Use for trend following and momentum trading.
Indian Examples**::
Reliance 20-day EMA often acts as dynamic support in uptrends.

Moving Average Crossover Strategies

Crossover strategies are based on the interaction between different moving averages.
Golden Cross**::
Short-term MA crosses above long-term MA (bullish).
Death Cross**::
Short-term MA crosses below long-term MA (bearish).
Crossover Types**::
Fast/slow crossovers, multiple MA crossovers.
Indian Context**::
Golden cross in Nifty 50 often signals major uptrends.

Golden Cross Strategy

Setup**::
50-day MA crosses above 200-day MA.
Entry Signal**::
Buy on golden cross with volume confirmation.
Stop Loss**::
Below 200-day MA or recent swing low.
Target**::
Next resistance level or 1:2 risk-reward ratio.
Confirmation**::
High volume on crossover day.
Indian Examples**::
Nifty 50 golden cross at 18,000-19,000 often leads to 20,000+ moves.

Death Cross Strategy

Setup**::
50-day MA crosses below 200-day MA.
Entry Signal**::
Sell on death cross with volume confirmation.
Stop Loss**::
Above 200-day MA or recent swing high.
Target**::
Next support level or 1:2 risk-reward ratio.
Confirmation**::
High volume on crossover day.
Example**::
Bank Nifty death cross often signals major downtrends.

50/200 DMA Strategy

The 50/200 DMA strategy is one of the most popular long-term trend-following strategies.
Trend Identification**::
Price above both MAs = uptrend, below both = downtrend.
Entry Signals**::
Buy on pullbacks to 50 DMA in uptrends.
Exit Signals**::
Sell on breaks below 50 DMA in uptrends.
Indian Context**::
This strategy works well with large-cap Indian stocks.

Uptrend Trading

Setup**::
Price above both 50 and 200 DMA.
Entry**::
Buy on pullbacks to 50 DMA with volume confirmation.
Stop Loss**::
Below 50 DMA or recent swing low.
Target**::
Next resistance level or 1:2 risk-reward ratio.
Confirmation**::
RSI oversold, bullish divergence.
Indian Examples**::
Buy Reliance on pullback to 50 DMA at ₹2,400 in uptrend.

Downtrend Trading

Setup**::
Price below both 50 and 200 DMA.
Entry**::
Sell on rallies to 50 DMA with volume confirmation.
Stop Loss**::
Above 50 DMA or recent swing high.
Target**::
Next support level or 1:2 risk-reward ratio.
Confirmation**::
RSI overbought, bearish divergence.
Example**::
Sell TCS on rally to 50 DMA at ₹3,400 in downtrend.

Multiple Moving Average Strategies

Using multiple moving averages provides more comprehensive trend analysis.
MA Alignment**::
All MAs aligned in same direction = strong trend.
MA Divergence**::
MAs moving in different directions = weak trend.
MA Spacing**::
Wide spacing between MAs = strong trend.
Indian Context**::
Use 20, 50, 100, 200 DMA for comprehensive analysis.

MA Alignment Strategy

Bullish Alignment**::
20 > 50 > 100 > 200 DMA.
Bearish Alignment**::
20 < 50 < 100 < 200 DMA.
Trading Application**::
Trade in direction of alignment.
Entry Signals**::
Buy on pullbacks in bullish alignment.
Exit Signals**::
Sell on breaks in bullish alignment.
Indian Examples**::
Nifty 50 bullish alignment often leads to major uptrends.

MA Divergence Strategy

Divergence Types**::
Short-term MAs moving opposite to long-term MAs.
Trading Application**::
Use divergence for reversal signals.
Confirmation**::
Use other indicators to confirm divergence.
Risk Management**::
Use tight stop losses for divergence trades.
Example**::
20 DMA below 50 DMA while 200 DMA still rising indicates weakness.

Moving Average as Support and Resistance

Moving averages often act as dynamic support and resistance levels.
Dynamic Support**::
Price bounces off MA in uptrends.
Dynamic Resistance**::
Price rejects MA in downtrends.
MA Strength**::
More touches = stronger support/resistance.
Volume Confirmation**::
High volume at MA levels increases reliability.
Indian Context**::
200 DMA often acts as major support/resistance in Indian markets.

MA Support Trading

Setup**::
Price in uptrend, pullback to MA level.
Entry**::
Buy on bounce from MA with volume confirmation.
Stop Loss**::
Below MA or recent swing low.
Target**::
Previous high or next resistance level.
Confirmation**::
RSI oversold, bullish candlestick patterns.
Indian Examples**::
Buy HDFC Bank on bounce from 200 DMA at ₹1,500.

MA Resistance Trading

Setup**::
Price in downtrend, rally to MA level.
Entry**::
Sell on rejection from MA with volume confirmation.
Stop Loss**::
Above MA or recent swing high.
Target**::
Previous low or next support level.
Confirmation**::
RSI overbought, bearish candlestick patterns.
Example**::
Sell Infosys on rejection from 200 DMA at ₹1,500.

Advanced Moving Average Techniques

Professional traders use advanced techniques to enhance moving average trading.
MA Confluence**::
Multiple MAs at same level.
MA Slope**::
Steep slope indicates strong trend.
MA Distance**::
Distance between price and MA indicates momentum.
MA Crossovers**::
Multiple MA crossovers for confirmation.
Indian Context**::
Use multiple timeframes for better accuracy.

MA Confluence Analysis

Multiple MAs**::
Look for confluence of multiple MAs at same level.
Strength Assessment**::
More MAs = stronger support/resistance.
Trading Application**::
Use confluence for high-probability trades.
Risk Management**::
Use confluence for stop loss placement.
Indian Examples**::
Reliance confluence of 20, 50, 100 DMA at ₹2,400.

MA Slope Analysis

Steep Slope**::
Indicates strong trend momentum.
Flat Slope**::
Indicates weak trend or consolidation.
Slope Change**::
Change in slope indicates trend change.
Trading Application**::
Use slope for trend strength assessment.
Risk Management**::
Adjust position size based on slope steepness.

Risk Management for MA Trading

Moving average trading requires specific risk management techniques.
Position Sizing**::
Risk 1-2% per trade.
Stop Loss Placement**::
Below/above MA levels.
Target Setting**::
Use MA levels for profit targets.
Portfolio Heat**::
Limit total exposure to 5-8% of portfolio.
Indian Context**::
Use ₹10-50 stops for large caps, ₹5-20 for mid caps.

Stop Loss Strategies

MA Stops**::
Below/above MA levels for stop losses.
Percentage Stops**::
2-3% from entry price.
ATR Stops**::
1.5-2x Average True Range.
Trailing Stops**::
Move stops in favorable direction.
Indian Market Context**::
Use ₹10-50 stops for large caps, ₹5-20 for mid caps.

Target Setting Methods

MA Targets**::
Use next MA level for targets.
Support/Resistance**::
Use support/resistance levels for targets.
Risk-Reward**::
Aim for at least 1:2 risk-reward ratio.
Confluence**::
Use confluence zones for targets.
Example**::
MA target at next resistance level for profit taking.

Conclusion

Moving averages are fundamental tools for trend identification and trading in Indian markets.
Key Takeaways**::
Use SMA for smooth trends, EMA for responsive signals, crossovers for trend changes, and always combine with proper risk management.
Action Items**::
Practice moving average analysis on historical charts, develop your trading plan, start with paper trading, and gradually increase position sizes as you gain experience. Remember that moving averages work best when combined with other technical analysis tools and market context understanding.
Share this article: