Candlestick Patterns Trading: 20 Essential Patterns for Indian Markets
Master 20 essential candlestick patterns for Indian markets including doji, hammer, engulfing, and reversal patterns. Learn to identify and trade these patterns using NSE and BSE stocks.
Candlestick Patterns Trading: 20 Essential Patterns for Indian Markets
What You Can Do Next
- Read the full article for complete insights
- Save for later reference
- Share with others learning about this topic
Image not available
Candlestick patterns are one of the most powerful tools in technical analysis, providing visual insights into market psychology and price action. Originating from Japanese rice trading, these patterns reveal the battle between buyers and sellers through the relationship between open, high, low, and close prices. In Indian markets, candlestick patterns are particularly effective due to the emotional nature of retail trading and institutional activity. This comprehensive guide covers 20 essential patterns, their psychology, and practical trading applications using real Indian stock examples.
Understanding Candlestick Anatomy
Basic Candlestick Components
Market Psychology in Candlesticks
Single Candlestick Patterns
Doji Patterns
Hammer and Shooting Star
Two-Candlestick Patterns
Engulfing Patterns
Harami Patterns
Three-Candlestick Patterns
Morning and Evening Stars
Three White Soldiers and Three Black Crows
Continuation Patterns
Rising and Falling Three Methods
Separating Lines
Advanced Pattern Recognition
Pattern Combinations
Multi-Timeframe Analysis
Trading Strategies and Risk Management
Entry Strategies
Risk Management Rules
Conclusion
Frequently Asked Questions
What are the most reliable candlestick patterns for Indian markets?
The most reliable patterns include Morning/Evening Star, Bullish/Bearish Engulfing, Hammer/Shooting Star, and Doji patterns. These patterns work well in Indian markets due to the emotional nature of retail trading and institutional activity. Always use volume confirmation and trade in the direction of the overall trend for best results.
How do I avoid false signals with candlestick patterns?
Avoid false signals by using volume confirmation (1.5x average volume), waiting for next candle confirmation, trading in the direction of the higher timeframe trend, and considering overall market conditions. False signals are common during low liquidity periods, so focus on active trading hours and avoid trading during news events.
What is the difference between reversal and continuation patterns?
Reversal patterns (Morning Star, Hammer, Engulfing) indicate a potential change in trend direction and are used for counter-trend trading. Continuation patterns (Rising/Falling Three Methods, Separating Lines) suggest the current trend will continue after a brief pause and are used for trend-following strategies.
How do I use candlestick patterns with other indicators?
Combine candlestick patterns with volume analysis, moving averages for trend direction, RSI for overbought/oversold conditions, and support/resistance levels for better accuracy. Use multiple timeframes - higher timeframe for trend direction and lower timeframe for precise entry timing. Always use proper risk management with stop losses.
What is the best timeframe for candlestick pattern trading?
The best timeframe depends on your trading style: day traders use 5-15 minute charts, swing traders use 1-4 hour charts, and position traders use daily charts. For Indian markets, daily charts work well for swing trading, while 15-minute charts are good for day trading. Use multiple timeframes for better confirmation and trend alignment.
Disclaimer: This analysis is for educational purposes only and should not be considered as investment advice. Past performance does not guarantee future results. Please consult with a qualified financial advisor before making investment decisions. Trading involves substantial risk of loss and is not suitable for all investors.
Continue Your Investment Journey
Discover more insights that match your interests

Bollinger Bands Trading Strategy: Squeeze Patterns & Volatility Analysis
Master Bollinger Bands trading with squeeze patterns, mean reversion, and breakout strategies for Indian markets.

Support and Resistance Trading: Complete Strategy Guide for Indian Markets
Master support and resistance trading with horizontal levels, trendlines, and volume confirmation strategies for Indian markets.

Risk Management for Technical Traders: Position Sizing & Stop-Loss Strategies
Master risk management for technical traders with position sizing, stop-loss strategies, and portfolio heat management.

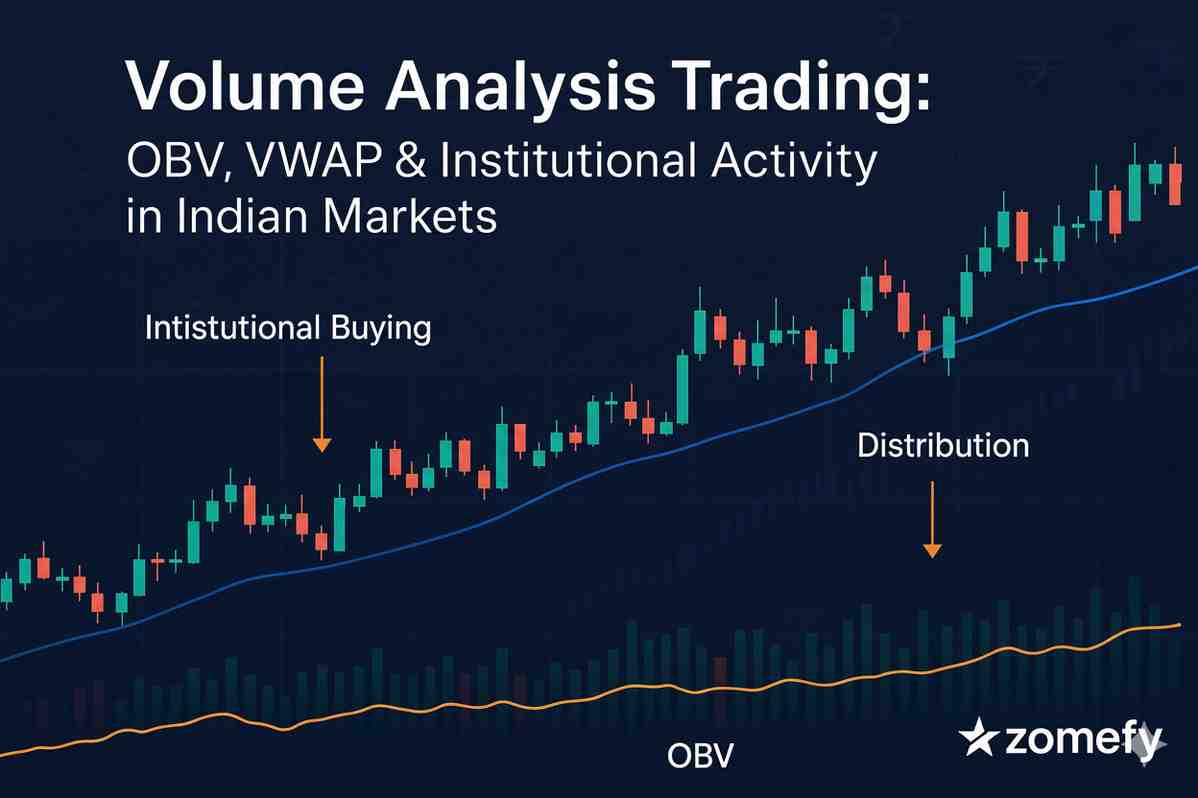
Volume Analysis Trading: OBV, VWAP & Institutional Activity in Indian Markets
Master volume analysis trading with OBV, VWAP, and institutional activity detection for Indian markets.
Explore More Insights
Continue your financial education journey
