TCS Stock Analysis 2025: DCF Model and Growth Prospects
Complete TCS stock analysis with DCF model, growth prospects, and investment recommendation for 2025.
TCS Stock Analysis 2025: DCF Model and Growth Prospects
What You Can Do Next
- Read the full article for complete insights
- Save for later reference
- Share with others learning about this topic
Image not available
Complete TCS stock analysis with DCF model, growth prospects, and investment recommendation for 2025.
Executive Summary
This comprehensive DCF analysis of TCS provides investors with a detailed framework to value India's largest IT services company. Using a 5-year projection model with conservative, base, and optimistic scenarios, we arrive at a fair value range of ₹3,800-4,200 per share, representing 15-25% upside from current levels.
Key Points:
- TCS fair value: ₹3,800-4,200 (15-25% upside)
- 5-year revenue CAGR: 8-12% (conservative to optimistic)
- Terminal growth rate: 3-4% (sustainable long-term)
- WACC: 10.5-11.5% (risk-adjusted discount rate)
- Key value drivers: Digital transformation, margin expansion, market share gains
TCS Business Model Analysis
Understanding TCS's business model is crucial for accurate DCF modeling. The company operates across multiple verticals with varying growth profiles and margin characteristics.
Revenue Streams Breakdown
TCS generates revenue through multiple streams, each with different growth characteristics and margin profiles.
Geographic Revenue Analysis
TCS's geographic diversification provides stability and growth opportunities across different markets.
5-Year Revenue Forecasting Model
Revenue forecasting for TCS requires understanding of multiple growth drivers including digital transformation trends, market share gains, and pricing dynamics.
Base Case Scenario (Most Likely)
The base case assumes continued digital transformation adoption with moderate market share gains.
Optimistic Scenario
The optimistic scenario assumes faster digital adoption and significant market share gains.
Conservative Scenario
The conservative scenario assumes slower digital adoption and increased competition.
Margin Expansion Analysis
TCS's margin profile is expected to improve through operational efficiency, digital service mix, and automation.
EBIT Margin Projections
EBIT margins are expected to expand through digital service mix improvement and operational efficiency.
Key Margin Drivers
Several factors will drive margin expansion over the next 5 years.
DCF Model Calculation
The DCF model uses a 5-year explicit forecast period followed by terminal value calculation.
Free Cash Flow Projections
Free cash flow is calculated as EBIT(1-T) + Depreciation - CapEx - Working Capital Changes.
Terminal Value Calculation
Terminal value is calculated using the perpetuity growth method with a 3.5% long-term growth rate.
WACC Calculation
Weighted Average Cost of Capital calculation for TCS.
Sensitivity Analysis
Sensitivity analysis shows how changes in key assumptions impact the fair value estimate.
Growth Rate Sensitivity
Impact of different growth rate assumptions on fair value.
WACC Sensitivity
Impact of different discount rates on fair value.
Terminal Growth Sensitivity
Impact of different terminal growth rates on fair value.
Investment Thesis
TCS represents a high-quality investment opportunity with strong fundamentals and reasonable valuation.
Bull Case
Strong arguments for investing in TCS.
Bear Case
Potential risks and challenges for TCS.
Key Catalysts
Events that could drive TCS stock performance.
Practical Tools & Resources
Downloadable tools and resources for TCS analysis and valuation.
Continue Your Investment Journey
Discover more insights that match your interests

Oil & Gas Sector Valuation: Integrated vs Pure-Play Analysis
Comprehensive oil & gas sector valuation analysis with integrated vs pure-play framework. Analyze Reliance, ONGC, Oil India, GAIL performance and investment opportunities in Indian oil & gas sector.

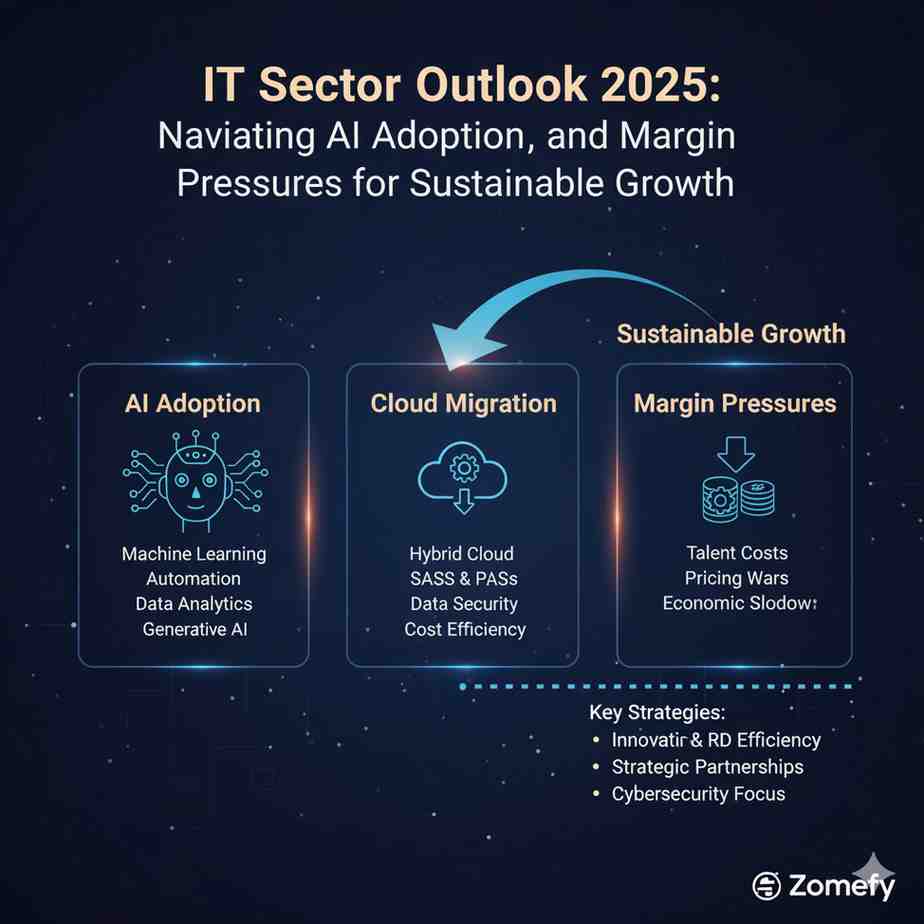
IT Sector Outlook 2025: Navigating AI Adoption, Cloud Migration, and Margin Pressures for Sustainable Growth
India’s IT sector is at a pivotal juncture in 2025, shaped by rapid AI adoption, accelerating cloud migration, and persistent margin pressures.

Fibonacci Trading Strategy: Retracements & Extensions for Indian Markets
Master Fibonacci trading with retracements, extensions, and confluence analysis for Indian markets.

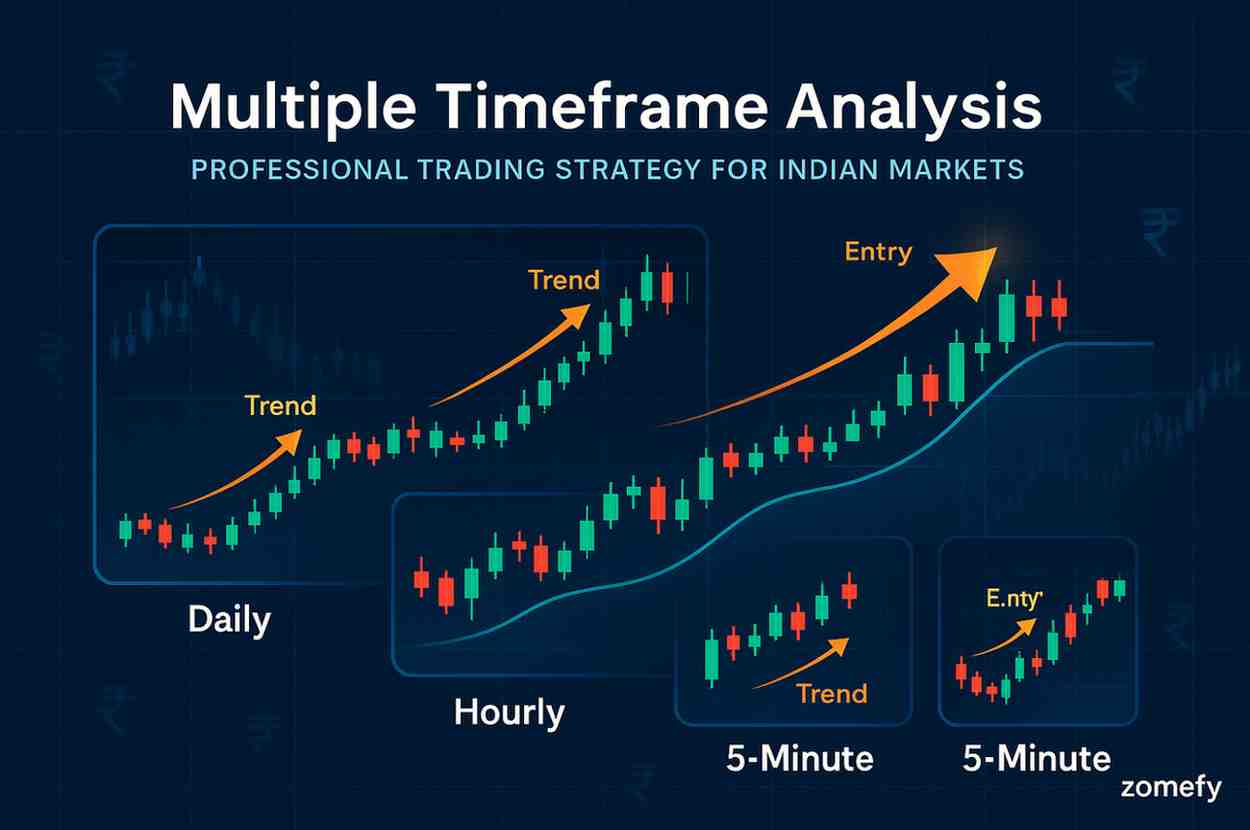
Multiple Timeframe Analysis: Professional Trading Strategy for Indian Markets
Master multiple timeframe analysis for professional trading in Indian markets. Learn top-down analysis and timeframe confluence.
Explore More Insights
Continue your financial education journey
