Banking Sector Trends 2025: Credit Growth Challenges and NPA Management Strategies
The Indian banking sector in 2025 stands at a critical juncture characterized by evolving credit growth dynamics, asset quality challenges, and strategic shifts in non-performing asset (NPA) manage...
Banking Sector Trends 2025: Credit Growth Challenges and NPA Management Strategies
What You Can Do Next
- Read the full article for complete insights
- Save for later reference
- Share with others learning about this topic
Image not available
The Indian banking sector in 2025 stands at a critical juncture characterized by evolving credit growth dynamics, asset quality challenges, and strategic shifts in non-performing asset (NPA) management. After a robust credit expansion phase in FY24, FY25 witnessed a moderation in credit growth to around 10-11%, influenced by tighter underwriting norms and macroeconomic factors. The Reserve Bank of India's (RBI) proactive monetary easing measures, including repo rate cuts and liquidity injections, are expected to fuel a revival in credit demand in FY26. However, this recovery unfolds amid sectoral credit growth disparities, rising competition between public and private sector banks, and persistent concerns over asset quality, especially in retail and unsecured lending segments. For retail investors and financial professionals, understanding these trends is essential for making informed investment decisions and portfolio adjustments. This article provides a comprehensive analysis of credit growth challenges, NPA management strategies, and actionable insights within the Indian banking context, supported by detailed data, company comparisons, and regulatory perspectives.
Credit Growth Trends and Challenges in Indian Banking
Credit growth in the Indian banking sector showed a notable moderation in FY25, with year-on-year growth slowing to approximately 10.2%-11% compared to over 20% in FY24. This deceleration reflects a combination of conservative lending practices, sectoral shifts, and macroeconomic factors such as inflationary pressures and global uncertainties. RBI data for August 2025 indicates that credit growth to industry slowed to 6.5%, down from 9.7% the previous year, signaling a broad-based cooling across key sectors including agriculture, personal loans, and services. However, MSMEs and select industries have maintained relatively robust credit demand, indicating a mixed sectoral pattern. The RBI’s monetary policy easing — including two 25-basis-point repo rate cuts and a 50-basis-point reduction in the cash reserve ratio (CRR) — along with liquidity injections totaling ₹6.9 trillion, aim to stimulate credit off-take in FY26. Despite these measures, challenges persist in deposit mobilization and the cost of funds, which remain elevated due to competitive pricing and customer preference for high-yield term deposits. The outlook for FY26 is cautiously optimistic, with expectations of credit growth rebounding to 10.4%-11.3%, supported by GST rate cuts and a revival in private investment cycles. However, the credit growth recovery is expected to be uneven, with private sector banks outperforming public sector banks in profit growth and lending momentum.
Sectoral Credit Growth Comparison
The Indian banking sector's credit growth exhibits significant sectoral variation, necessitating a nuanced approach to lending and risk assessment. The following table summarizes credit growth rates by sector as of August 2025, highlighting areas of strength and weakness:
Sector | Credit Growth Aug 2024 (%) | Credit Growth Aug 2025 (%) | Remarks |
|---|---|---|---|
| Industry | 9.7 | 6.5 | Slowing due to cautious corporate lending |
| MSMEs | 8.5 | 7.8 | Robust demand sustained |
| Agriculture | 10.2 | 5.0 | Significant deceleration |
| Personal Loans | 12.0 | 7.2 | Moderation due to risk concerns |
| Services | 9.0 | 6.0 | Credit tightening observed |
This sectoral slowdown, especially in agriculture and personal loans, underscores the need for banks to recalibrate risk models and diversify credit portfolios. For investors, focusing on banks with diversified sectoral exposures and strong risk controls is prudent.
Public vs Private Sector Banks: Credit and Profitability
There is a marked divergence in credit growth and profitability trends between public sector banks (PSBs) and private sector banks (PVBs). Private banks like HDFC Bank are projected to grow net income by 9.5% in FY26, while PSBs such as State Bank of India (SBI) face a slight decline of 3.1%. This divergence stems from PVBs' stronger retail franchise, superior risk management, and faster adoption of digital banking technologies. PSBs continue to grapple with legacy NPAs and slower credit mobilization.
Bank | Net Income FY25 (₹ Cr) | Net Income Growth FY26 (%) | Credit Growth FY25 (%) | Key Strengths |
|---|---|---|---|---|
| HDFC Bank | 673,000 | 9.5 | 12.0 | Strong retail, digital innovation |
| ICICI Bank | 410,000 | 8.0 | 11.5 | Diversified portfolio, tech-driven |
| State Bank of India | 710,000 | -3.1 | 8.0 | Large scale, government backing |
| Punjab National Bank | 110,000 | 0.5 | 7.5 | Improving asset quality |
For investors, private sector banks offer higher growth potential but may carry slightly higher valuation multiples. PSBs may provide value plays with improving fundamentals but require careful NPA risk assessment.
NPA Management Strategies: Challenges and Innovations
Non-performing assets (NPAs) continue to be a critical concern for Indian banks, impacting profitability, capital adequacy, and credit growth capacity. Although gross NPAs have declined from peak levels in recent years due to aggressive resolution mechanisms, including Insolvency and Bankruptcy Code (IBC) proceedings, the risk of asset quality deterioration remains, especially in retail unsecured loans and stressed corporate sectors. The RBI’s regulatory framework emphasizes early identification, stringent provisioning norms, and resolution timelines to contain NPA risks.
Banks are increasingly adopting innovative strategies to manage NPAs, including technology-driven credit monitoring, securitization, and asset reconstruction. Digital tools enable real-time risk assessment and early warning signals, improving the quality of credit portfolios. Moreover, banks are focusing on restructuring viable stressed assets to avoid outright defaults.
The following table compares key NPA management metrics across selected banks as of Q2 FY26:
Bank | Gross NPA Ratio (%) | Net NPA Ratio (%) | Provision Coverage Ratio (%) | Restructured Assets (%) |
|---|---|---|---|---|
| State Bank of India | 5.2 | 2.3 | 70 | 1.8 |
| HDFC Bank | 1.1 | 0.4 | 85 | 0.5 |
| ICICI Bank | 2.5 | 1.0 | 75 | 1.0 |
| Punjab National Bank | 6.0 | 3.0 | 65 | 2.5 |
The higher provision coverage ratio (PCR) and lower NPA ratios of private banks reflect stronger asset quality management. PSBs, while improving, still carry legacy stress. Investors should evaluate banks’ NPA trends in conjunction with credit growth and provisioning policies to assess risk-reward balance.
Pros and Cons of NPA Resolution Methods
Indian banks employ multiple NPA resolution methods, each with distinct advantages and drawbacks. The table below summarizes the pros and cons to guide investment considerations:
Resolution Method | Pros | Cons |
|---|---|---|
| Insolvency and Bankruptcy Code (IBC) | Fast-track resolution, legal clarity, asset recovery | Lengthy court processes, recovery uncertainty |
| One-Time Settlements (OTS) | Immediate cash inflow, reduces NPA burden | Potential undervaluation, may encourage moral hazard |
| Asset Reconstruction Companies (ARCs) | Specialized recovery, off-balance-sheet management | Discounted asset purchase, dependence on ARC health |
| Restructuring and Moratoriums | Preserves borrower viability, avoids defaults | Risk of stress build-up, delayed recognition of NPAs |
Effective NPA management requires banks to balance aggressive recovery with sustainable borrower rehabilitation. Retail investors should monitor banks’ resolution strategies and provisioning to gauge asset quality risks.
Investment Strategies and Risk Considerations in 2025
Given the evolving banking sector landscape in 2025, retail investors and financial professionals should adopt nuanced strategies that balance growth prospects with risk management. Key actionable insights include:
- Focus on Private Sector Banks: With higher credit growth potential and superior asset quality metrics, banks like HDFC Bank, ICICI Bank, and Kotak Mahindra Bank present attractive investment opportunities.
- Monitor Asset Quality Trends: Regularly review banks’ NPA ratios, provision coverage, and restructuring exposures to avoid surprises.
- Leverage Sectoral Diversification: Banks with diversified credit portfolios across MSMEs, industry, and retail segments are better positioned to withstand sector-specific downturns.
- Consider Valuation Metrics: While private banks trade at premium valuations, PSBs may offer value plays if asset quality improves and credit growth stabilizes.
- Stay Updated on Regulatory Changes: RBI’s monetary policy and regulatory interventions can impact bank margins and credit cycles.
The table below presents a risk-return analysis of select banks based on recent financial metrics:
Bank | 1-Year Return (%) | ROE (%) | Gross NPA (%) | P/E Ratio |
|---|---|---|---|---|
| HDFC Bank | 18.5 | 17.8 | 1.1 | 24.5 |
| ICICI Bank | 15.2 | 15.0 | 2.5 | 22.0 |
| State Bank of India | 8.0 | 11.5 | 5.2 | 16.0 |
| Punjab National Bank | 5.5 | 8.0 | 6.0 | 14.0 |
Investors should weigh growth prospects against asset quality risks and valuation premiums. Diversification across private and improving public sector banks can mitigate sectoral risks. Furthermore, incorporating digital banking trends and regulatory developments will enhance portfolio resilience.
Comparative Analysis of Leading Banks
The following table compares key financial and valuation metrics of leading Indian banks to aid investment decision-making:
Bank | Market Cap (₹ Cr) | Net Profit FY25 (₹ Cr) | Credit Growth FY25 (%) | Gross NPA (%) | ROE (%) | P/E Ratio |
|---|---|---|---|---|---|---|
| HDFC Bank | 8,50,000 | 67,300 | 12.0 | 1.1 | 17.8 | 24.5 |
| ICICI Bank | 5,10,000 | 41,000 | 11.5 | 2.5 | 15.0 | 22.0 |
| State Bank of India | 6,00,000 | 71,000 | 8.0 | 5.2 | 11.5 | 16.0 |
| Punjab National Bank | 1,00,000 | 11,000 | 7.5 | 6.0 | 8.0 | 14.0 |
This comparison highlights the premium valuation and superior profitability of private banks, balanced against higher asset quality risks in PSBs. Investors should align choices with risk appetite and investment horizon.
Continue Your Investment Journey
Discover more insights that match your interests

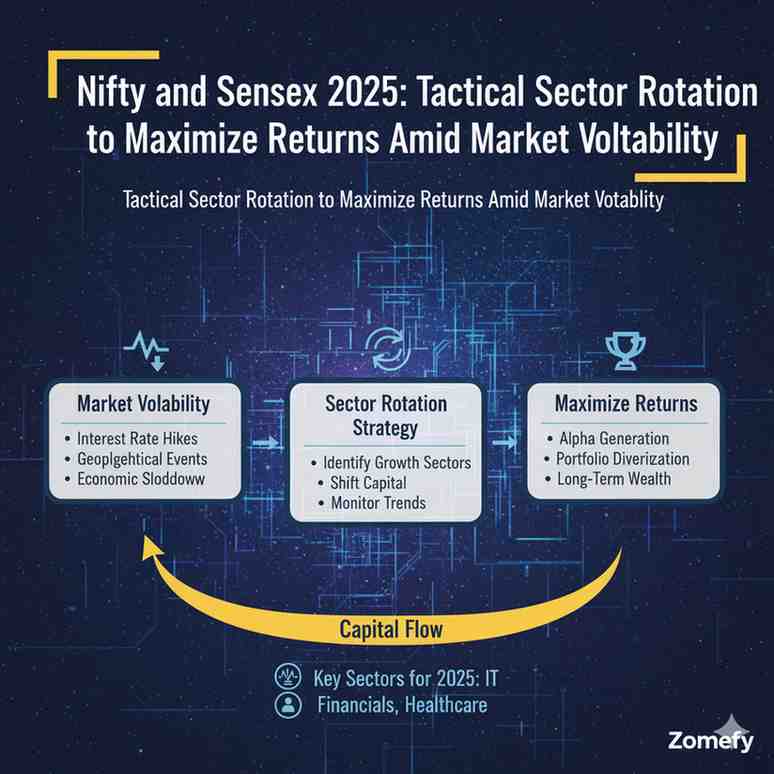
Nifty and Sensex 2025: Tactical Sector Rotation to Maximize Returns Amid Market Volatility
As we advance into 2025, the Indian equity markets represented by the Nifty 50 and BSE Sensex continue to navigate a complex environment marked by heightened volatility, geopolitical tensions, and ...

Geopolitical Fragmentation & Infrastructure Boom 2025: How Indian Midcap Infrastructure Stocks Are Positioned to Capitalize on Deglobalization & Domestic Capex Acceleration
India’s midcap infrastructure sector is at a pivotal juncture, shaped by two powerful forces: geopolitical fragmentation and a domestic capex boom.

India’s Digital Lending Boom 2025: Opportunities, Risks, and Regulatory Outlook for Retail Investors
India's digital lending sector is experiencing a transformative boom, driven by rapid technological adoption, expanding fintech ecosystems, and progressive regulatory frameworks.

CEE Unicorns 2025: How Physical Tech and Deeptech Are Reshaping Europe’s Startup Landscape
Central and Eastern Europe (CEE) has emerged as one of Europe's most dynamic startup ecosystems, fundamentally reshaping the continent's innovation landscape.
Explore More Insights
Continue your financial education journey
