How to Analyze Mutual Fund Performance: Alpha, Beta, Sharpe Explained
Learn how to analyze mutual fund performance using Alpha, Beta, Sharpe ratio and other key metrics. Complete guide to mutual fund performance analysis for 2025.
How to Analyze Mutual Fund Performance: Alpha, Beta, Sharpe Explained
What You Can Do Next
- Read the full article for complete insights
- Save for later reference
- Share with others learning about this topic
Image not available
Analyzing mutual fund performance goes beyond just looking at returns. Understanding key performance metrics like Alpha, Beta, Sharpe ratio, and other risk-adjusted measures is crucial for making informed investment decisions. This comprehensive guide explains how to analyze mutual fund performance using professional-grade metrics and frameworks.
Key Performance Metrics
Return Metrics
Risk Metrics
Alpha Analysis
Alpha Calculation
Alpha Examples
Beta Analysis
Beta Calculation
Beta Examples
Sharpe Ratio Analysis
Sharpe Ratio Calculation
Sharpe Ratio Examples
Other Important Metrics
Sortino Ratio
Calmar Ratio
Performance Analysis Framework
Analysis Steps
Decision Framework
Conclusion
Frequently Asked Questions
What is the difference between Alpha and Beta in mutual fund analysis?
Alpha measures excess returns over benchmark after adjusting for risk, indicating fund manager's skill. Beta measures fund's sensitivity to market movements, indicating volatility relative to market. Alpha above 2-3% is considered good, while beta between 0.8-1.2 is considered moderate risk.
How to interpret Sharpe ratio for mutual funds?
Sharpe ratio measures risk-adjusted returns by dividing excess returns by standard deviation. Higher Sharpe ratio indicates better risk-adjusted returns. Sharpe ratio above 1.0 is considered good, above 1.5 is excellent. Compare Sharpe ratio with benchmark and peer funds for better interpretation.
What are the key metrics to analyze mutual fund performance?
Key metrics include Alpha (excess returns over benchmark), Beta (sensitivity to market), Sharpe ratio (risk-adjusted returns), Sortino ratio (downside risk-adjusted returns), Calmar ratio (return to drawdown), Information ratio (active return per tracking error), and Tracking error (volatility of excess returns).
How to compare mutual fund performance with benchmark?
Compare absolute returns, risk-adjusted returns, and consistency over different time periods. Use metrics like alpha, information ratio, and tracking error. Consider performance across different market cycles. Look for consistent outperformance rather than just high returns in specific periods.
What is a good Sharpe ratio for mutual funds?
Sharpe ratio above 1.0 is considered good, above 1.5 is excellent. Compare with benchmark and peer funds for better interpretation. Consider Sharpe ratio consistency over different market cycles. Higher Sharpe ratio indicates better risk-adjusted returns and fund management quality.
Disclaimer: This analysis is for educational purposes only and should not be considered as investment advice. Past performance does not guarantee future results. Please consult with a qualified financial advisor before making investment decisions. Mutual fund investments are subject to market risks.
Continue Your Investment Journey
Discover more insights that match your interests

Best ELSS Funds 2025: Tax Saving + Growth Potential
Discover the best ELSS funds for 2025 with tax saving benefits and growth potential. Compare top performing ELSS funds with detailed analysis and investment recommendations.

Index Funds vs Active Funds: Which Wins in 2025?
Comprehensive comparison of index funds vs active funds for 2025. Analyze performance, costs, and suitability for different investor types.

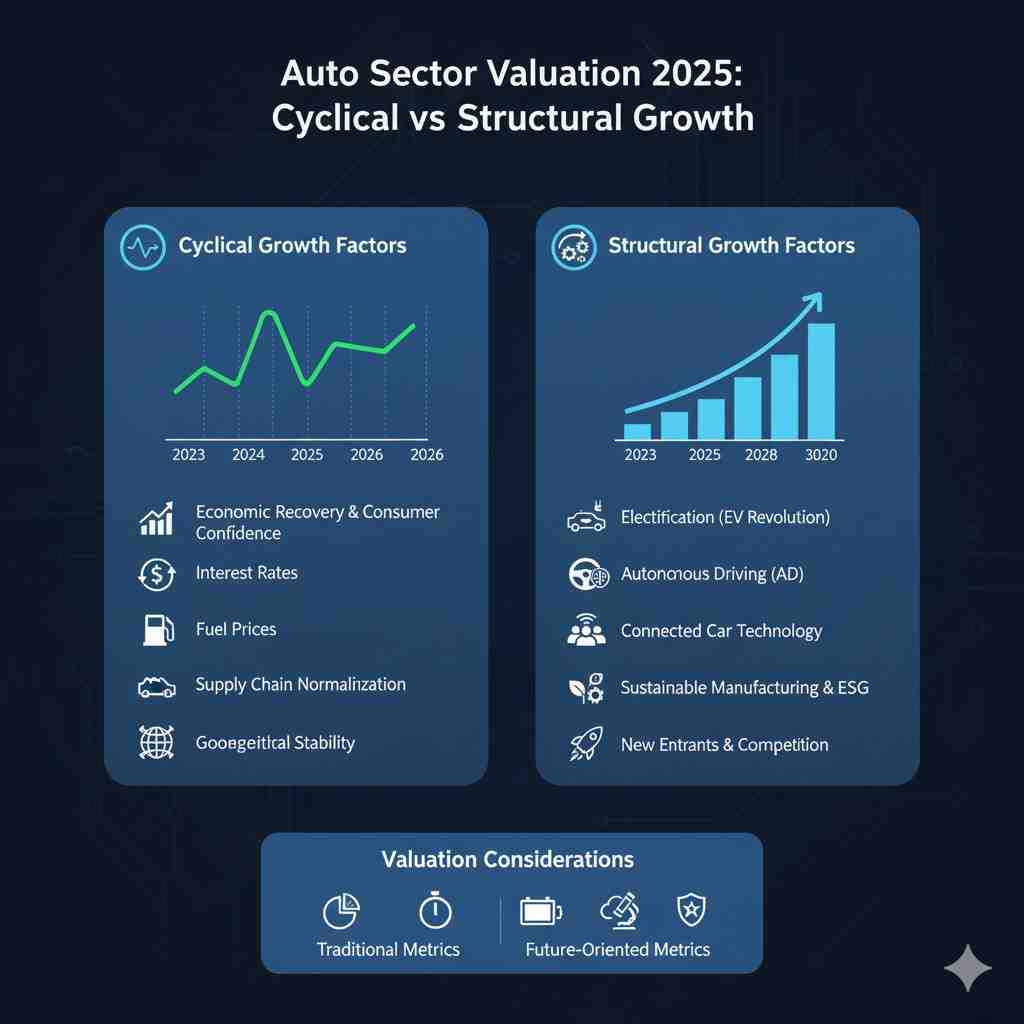
Auto Sector Valuation 2025: Cyclical vs Structural Growth
Comprehensive auto sector valuation analysis for 2025 with cyclical vs structural growth framework. Analyze Maruti, Tata Motors, Mahindra, Bajaj Auto performance and investment opportunities in Indian auto sector.

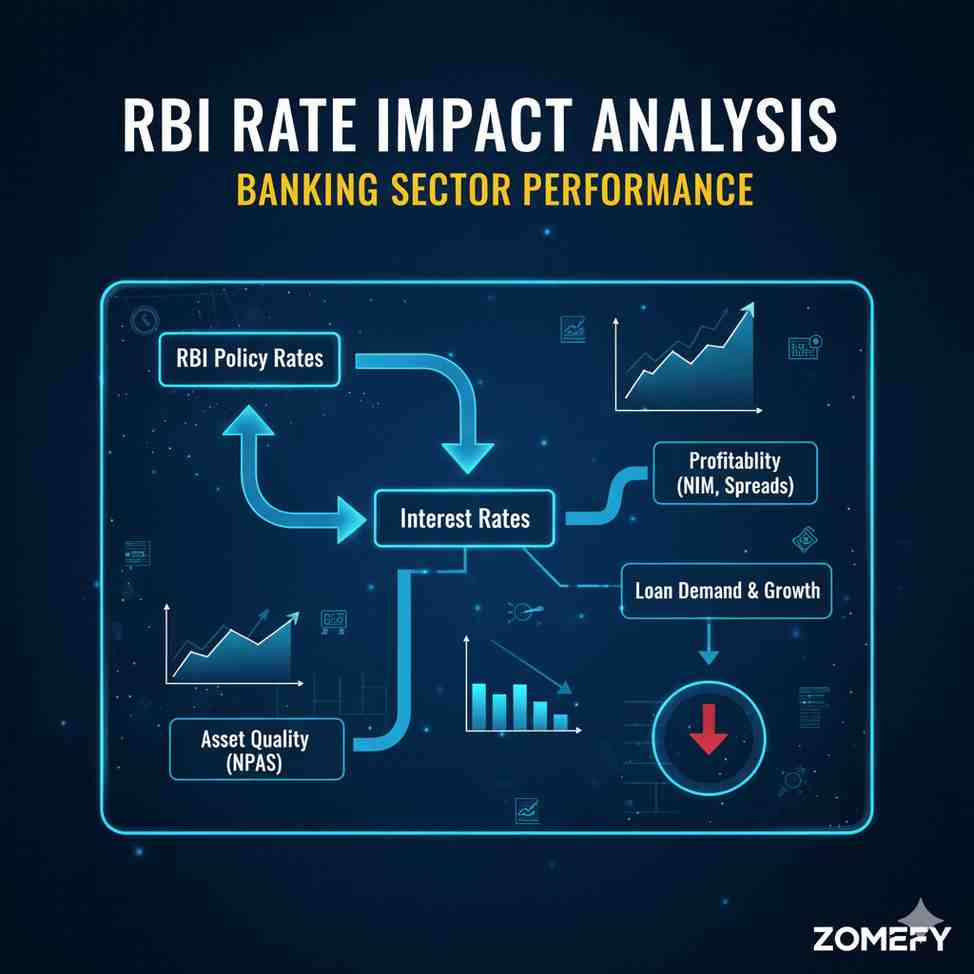
RBI Rate Impact Analysis: Banking Sector Performance
Comprehensive analysis of how RBI rate changes impact banking sector performance with historical data and future outlook.
Explore More Insights
Continue your financial education journey
