
Glenmark Pharma: Can New Product Pipeline and Global Market Strategy Drive Sustained Profitability Amidst Regulatory
Glenmark Pharmaceuticals, an Indian pharmaceutical company with a global footprint, has recently reported robust Q1 FY27 earnings, showcasing a significant.
Glenmark Pharma: Can New Product Pipeline and Global Market Strategy Drive Sustained Profitability Amidst Regulatory
What You Can Do Next
- Read the full article for complete insights
- Save for later reference
- Share with others learning about this topic
Image not available
Glenmark Pharmaceuticals, an Indian pharmaceutical company with a global footprint, has recently reported robust Q1 FY27 earnings, showcasing a significant jump in profitability and revenue. This performance, driven by strong growth across its Indian formulations, North American, and European businesses, acts as a crucial trigger for a deeper look into the company's long-term investment viability. While the headline numbers paint an optimistic picture, Indian retail investors need to move beyond superficial positivity to understand the underlying business dynamics, the sustainability of its new product pipeline, the efficacy of its global market strategy, and the inherent risks amidst a complex regulatory landscape. This analysis aims to dissect Glenmark's business fundamentals, scrutinize its valuation, and highlight potential pitfalls that the market might be overlooking, providing a non-consensus perspective on its future trajectory.
Data Freshness
Updated on: 2026-08-01 As of: 2026-08-01 Latest price: Rs 2234.1 (NSE) as of 2026-08-01 Market cap: Rs 63,040.8 crore Latest earnings period: FY27 Q1 (ended June 30, 2026) Key sources: https://www.bajajfinserv.in/stocks/glenmark-pharmaceuticals-share-price; https://economictimes.indiatimes.com/glenmark-pharma-ltd/stocks/companyid-13583.cms; https://investywise.com/stocks/glenmark-pharmaceuticals-q1-fy27-results
News Trigger Summary
Event: Glenmark Pharmaceuticals announced its Q1 FY27 consolidated financial results, reporting a 23% year-on-year (YoY) increase in revenue to Rs 4,018 crore and a significant surge in Profit After Tax (PAT) to Rs 483 crore from Rs 47 crore in the corresponding quarter last year. EBITDA grew by 39% YoY to Rs 805 crore, with margins expanding to 20%. Date: July 31, 2026 Why the Market Reacted: The market reacted positively to the strong Q1 FY27 performance, particularly the multi-fold jump in PAT and healthy margin expansion, which signaled a recovery and robust operational execution across key markets. The results beat expectations, reinforcing confidence in the company's strategic direction. Why This Is Not Just News: While strong quarterly results are encouraging, this article delves deeper than the immediate headlines. The exceptional PAT growth in Q1 FY27 was partly due to a low base in the previous year, which had significant exceptional items. This analysis will explore whether the current growth drivers, including new product launches like Ryaltris and Winlevi, and the global market strategy, can deliver sustained profitability and justify current valuations, especially considering past inconsistencies in profitability and ongoing regulatory challenges. We aim to identify the durability of these improvements and the factors that could derail the thesis over the next 6-12 months.
Core Thesis in One Sentence
Glenmark Pharma's investment case hinges on its ability to transition from a generics-heavy model to sustained, profitable growth driven by its specialty and innovative product pipeline, particularly in respiratory and dermatology, while navigating intense global pricing pressures and regulatory hurdles.
Business Model Analysis
Glenmark Pharmaceuticals operates as a global research-led pharmaceutical company, generating revenue primarily through the development, manufacturing, and marketing of branded generics, specialty products, and over-the-counter (OTC) drugs. Its business is diversified across four key layers: a strong branded-generics foundation in India and emerging markets, a growing specialty segment in the US and Europe, a pipeline of in-licensed oncology drugs, and a self-sustaining biologics innovation unit. The company's geographical revenue streams are significant, with India, North America, Europe, and the Rest of the World (RoW) contributing to its top line. India, its home market, remains a crucial profit engine, demonstrating consistent outperformance in secondary sales in its core therapeutic areas of dermatology, respiratory, and cardiac. The company holds a strong market position, ranking 2nd in Dermatology, 3rd in Respiratory, and 4th in the Cardiac segment in India as of Q4 FY26. In North America, Glenmark primarily focuses on generics, but is increasingly shifting towards specialty products and complex generics, with recent launches like Olanzapine for Injection and Progesterone Vaginal Inserts aimed at offsetting generic pricing pressure. Europe and other emerging markets (including RCIS, LATAM, MEA, and APAC) are targeted for growth through its branded business and expanding respiratory and dermatology portfolios, with products like Ryaltris (nasal spray for allergic rhinitis) gaining significant traction. The company's strategy involves disciplined reinvestment into these core growth drivers and leveraging its global manufacturing and distribution backbone. The profitability largely stems from its branded generic portfolio in India and emerging markets, which typically command better margins than pure generics. The specialty segment, while requiring higher R&D and marketing investment, offers the potential for higher and more sustainable margins due to patent protection and differentiated offerings, as seen with Winlevi, an acne cream recently approved in Europe. However, the success of this model is heavily dependent on successful product development, regulatory approvals, and effective commercialization in highly competitive markets.
Key Financial Metrics
Metric | FY25 (Rs Cr) | FY26 (Rs Cr) | Q1 FY27 (Rs Cr) | Q1 FY27 YoY Growth (%) |
|---|---|---|---|---|
| Revenue | 16,982.5 | 16,982.5 | 4,018 | 23.1% |
| EBITDA | 5,033.0 | 5,033.0 | 805 | 39.0% |
| PAT | 1,362.0 | 1,362.0 | 483 | 927.7% |
| EBITDA Margin (%) | 29.6 | 29.6 | 20.0 | +2.2 pp |
| PAT Margin (%) | 8.0 | 8.0 | 11.8 | +10.3 pp |
| ROE (FY end) (%) | -1.0 (Mar-25) | -0.83 (Mar-26) | N/A | N/A |
| ROCE (FY end) (%) | 9.60 (Mar-25) | 6.25 (Mar-26) | N/A | N/A |
| Debt/Equity (FY end) | 0.258 (Mar-25) | 0.0102 (Mar-26) | N/A | N/A |
Glenmark's Q1 FY27 results indicate a strong operational rebound, with revenue growing over 23% and EBITDA expanding by 39% YoY. The reported PAT surge of over 900% is impressive but must be viewed in context of a low base in Q1 FY26 due to exceptional items. While the EBITDA margin of 20% in Q1 FY27 shows improvement, it is still below the management's stated target of 23% for FY27. The annual figures for FY25 and FY26 show revenue remaining stagnant at Rs 16,982.5 Cr and PAT at Rs 1,362 Cr, which suggests that the company faced challenges in the preceding fiscal year, possibly due to the exceptional items and pricing pressures. A critical concern is the reported negative Return on Equity (ROE) of -0.83% for FY26 and -1.0% for FY25, contrasting sharply with the robust Q1 FY27 PAT. This suggests that while recent quarters show a turnaround, the company's historical profitability has been inconsistent, impacting shareholder returns. The Return on Capital Employed (ROCE) also saw a decline to 6.25% in FY26 from 9.60% in FY25, indicating less efficient capital utilization. A significant positive is the drastic reduction in Debt/Equity to 0.0102 in FY26 from 0.258 in FY25, indicating a near debt-free balance sheet, which provides financial flexibility.
What the Market Is Missing
The market, in its enthusiasm for Glenmark's strong Q1 FY27 results and the promise of its specialty pipeline, might be underestimating the inherent volatility and execution risks associated with its strategic pivot. While the narrative of transitioning from a generics-led model to a specialty-driven one is appealing, the path is fraught with challenges. Investors might be assuming a linear progression in the commercialization of new products like Winlevi in Europe and the continued success of Ryaltris. However, the European market, though attractive for specialty products, is highly fragmented and requires significant investment in building localized sales and marketing infrastructure. The pace of market penetration and reimbursement approvals can be slower than anticipated, impacting revenue ramp-up. Furthermore, the 'low base' effect that amplified Q1 FY27's PAT growth needs careful consideration. A multi-fold jump from Rs 47 crore to Rs 483 crore is impressive, but it obscures the underlying profitability challenges faced in the previous fiscal year, as evidenced by the negative ROE for FY25 and FY26. The market might also be downplaying the lingering pricing pressures in the US generics segment, which remains a substantial part of Glenmark's revenue. While new launches are mitigating some of this pressure, the structural challenges of the US generics market are unlikely to disappear. Moreover, the regulatory environment is a constant overhang; the 6 observations from the June 2026 Goa facility Form 483 inspection, though not immediately critical, signal ongoing compliance requirements that can divert management attention and resources. The market might be overly optimistic about management's ability to consistently achieve its 23% EBITDA margin target, given the historical fluctuations and the investment intensity of specialty product launches. The long gestation periods and high failure rates in drug development mean that the 'innovation-led platforms' carry significant R&D risk that may not be fully priced into current valuations.
Valuation and Expectations
Metric | Glenmark Pharma (TTM/FY26) | Peer 1: Cipla (TTM/FY26) | Peer 2: Dr. Reddy's (TTM/FY26) | Peer 3: Lupin (TTM/FY26) |
|---|---|---|---|---|
| Market Cap (Rs Cr) | 63,040.8 | 1,180,000 | 95,829 | 1,10,421.66 |
| Latest Price (Rs) | 2234.1 | 1,472.00 (Jul 31, 2026) | 1,148 (Jul 24, 2026) | 2415 (Aug 1, 2026) |
| P/E Ratio (TTM) | 46.29 | 29.0 | 20.2 | 17.34 |
| P/B Ratio | 5.88 (ET Money, Jul 31, 2026) | N/A | N/A | 3.66 (Kotak Neo, Jul 31, 2026) |
| EV/EBITDA | N/A | N/A | N/A | N/A |
Glenmark Pharma's TTM P/E ratio of 46.29 appears significantly higher than its peers like Cipla (29.0), Dr. Reddy's (20.2), and Lupin (17.34). This premium suggests that the market is pricing in substantial future growth and a successful transition to a higher-margin specialty business. Investors are likely projecting strong, sustained earnings growth from new product launches and global market expansion to justify this elevated multiple. The current valuation implies expectations for Glenmark to not only meet but exceed its stated operational targets, including a consistent 23% EBITDA margin and robust revenue growth from its differentiated portfolio. Any hiccup in product commercialization, slower-than-expected market penetration, or intensified pricing pressure in generics could lead to a re-rating of the stock. While the low debt-to-equity ratio is a positive, the historical inconsistency in ROE and ROCE indicates that the quality of earnings and capital efficiency have been concerns, which the current P/E ratio does not fully reflect. The market seems to be betting heavily on the 'transformation' story, leaving little room for error.
Bull, Base, and Bear Scenarios
Scenario | Key Assumptions | Revenue (FY27E Rs Cr) | PAT (FY27E Rs Cr) | Implied P/E (FY27E) | Share Price (Rs) |
|---|---|---|---|---|---|
| Bull Case | Strong Ryaltris/Winlevi adoption, US specialty growth, stable generics pricing, 23%+ EBITDA margin. | ~19,000 - 20,000 | ~1,800 - 2,000 | 31.5 - 35.0 | ~2,500 - 2,800 |
| Base Case | Moderate specialty growth, continued US generics pressure, 20-22% EBITDA margin, India growth consistent. | ~17,500 - 18,500 | ~1,200 - 1,400 | 45.0 - 52.5 | ~2,000 - 2,200 |
| Bear Case | Slower specialty ramp-up, increased US generics competition, regulatory setbacks, margin compression below 20%. | ~16,000 - 17,000 | ~800 - 1,000 | 63.0 - 78.8 | ~1,400 - 1,700 |
In a Bull Case, Glenmark successfully executes its specialty strategy, with Ryaltris and Winlevi achieving rapid market penetration and strong pricing, while US specialty launches gain significant traction. This scenario assumes a sustained EBITDA margin above 23% and minimal impact from generic pricing pressure or regulatory issues. The implied P/E of 31.5-35.0 for FY27E suggests a premium over peers, justified by higher growth and margin profile. The Base Case assumes a more realistic scenario where specialty product growth is moderate, and US generics continue to face pricing pressure, partially offset by India's consistent performance. EBITDA margins hover around 20-22%. In this scenario, the current share price might already reflect much of this expected performance, leading to a higher implied P/E relative to current earnings. The Bear Case envisions significant headwinds, including slower-than-expected adoption of new specialty products, intensified competition in the US generics market, and potential regulatory challenges impacting manufacturing or product approvals. Margin compression below 20% would severely impact profitability. In this scenario, the current valuation would appear stretched, leading to a significant downside as the market re-rates the stock based on lower earnings expectations. The wide range of implied P/E ratios across scenarios highlights the high degree of uncertainty in Glenmark's future earnings trajectory and the sensitivity of its valuation to execution success.
Key Risks and Thesis Breakers
Peer Comparison
Company | Market Cap (Rs Cr) | Latest Price (Rs) | P/E (TTM) | ROE (FY26/TTM) (%) | ROCE (FY26/TTM) (%) |
|---|---|---|---|---|---|
| Glenmark Pharma | 63,040.8 | 2234.1 | 46.29 | -0.83 (FY26) | 6.25 (FY26) |
| Cipla Ltd. | 1,180,000 | 1,472.00 | 29.0 | N/A | N/A |
| Dr. Reddy's Labs | 95,829 | 1,148 | 20.2 | 11.2 (FY26) | 13.0 (FY26) |
| Lupin Ltd. | 1,10,421.66 | 2415 | 17.34 | 27.01 (FY26) | 31.06 (FY26) |
Compared to its peers like Cipla, Dr. Reddy's, and Lupin, Glenmark Pharma trades at a significantly higher TTM P/E multiple of 46.29, despite having a considerably smaller market capitalization. This premium is particularly striking when considering its negative ROE of -0.83% and lower ROCE of 6.25% for FY26, which lag behind Dr. Reddy's (ROE 11.2%, ROCE 13.0%) and Lupin (ROE 27.01%, ROCE 31.06%). The market appears to be assigning a substantial 'growth premium' to Glenmark, betting on its specialty pipeline and global expansion strategy to deliver superior future earnings and margin expansion. This implies that Glenmark is perceived as being in a transformative phase, justifying a higher valuation multiple than more established, consistently profitable generic players. However, this premium is fragile; if the company fails to deliver on the promised growth and margin expansion from its specialty portfolio, or if its profitability metrics do not improve dramatically, a significant re-rating to align with peer multiples could occur. The current valuation suggests that Glenmark needs to 'earn' its premium through sustained, high-quality earnings, rather than just the promise of future growth.
Who Should and Should Not Consider This Stock
Suitable For
- Investors with a high-risk appetite comfortable with long-term growth stories dependent on successful R&D and commercialization of new drugs.
- Those who believe in the management's ability to execute a complex global specialty strategy and navigate intense regulatory environments.
- Investors seeking exposure to the Indian pharmaceutical sector's specialty and innovation segments, willing to overlook historical inconsistencies in profitability for future potential.
Not Suitable For
- Conservative investors prioritizing stable earnings, consistent profitability, and lower valuation multiples.
- Those seeking immediate returns or uncomfortable with the inherent uncertainties and execution risks of a company undergoing a business model transition.
- Investors who are highly sensitive to regulatory risks or prolonged pricing pressures in the generics market.
What to Track Going Forward
Final Take
Glenmark Pharmaceuticals stands at a critical juncture, attempting to pivot towards a more profitable specialty and innovation-driven model while maintaining its strong branded generics presence. The Q1 FY27 results offer a glimpse of this potential, with impressive revenue and PAT growth, albeit from a low base. The market's current valuation, reflected in a higher P/E compared to peers, implicitly discounts significant future success in this transition. However, investors must critically assess the sustainability of this growth. The company faces formidable challenges, including persistent pricing pressure in the US generics market, the high costs and inherent risks of specialty drug development and commercialization, and the ever-present regulatory scrutiny. The historical inconsistency in profitability metrics like ROE and ROCE serves as a reminder that execution is paramount. While the balance sheet strength, marked by significantly reduced debt, provides some comfort, the long-term investment thesis hinges on Glenmark's ability to consistently deliver on its promises of higher-margin growth. Investors should remain vigilant, focusing on tangible progress in specialty product ramp-up, sustained margin expansion, and a clean regulatory track record, rather than being swayed solely by headline numbers. The path ahead is promising but fraught with execution risks that could easily unravel the current optimistic narrative.
Frequently Asked Questions
What drove Glenmark Pharma's strong Q1 FY27 performance?
Glenmark's Q1 FY27 growth was broad-based, with India formulations growing 15.5% YoY and positive contributions from North America and Europe. Key drivers included first-to-market respiratory launches in the US, continued traction for specialty products like Ryaltris globally and Winlevi in Europe, and overall improved operating efficiency.
What are the key risks to Glenmark Pharma's investment thesis?
Key risks include persistent pricing pressure in the US generics market, regulatory scrutiny (e.g., Goa facility Form 483 observations in June 2026), the high capital expenditure and R&D intensity required for specialty and innovation-led growth, and the execution risk associated with scaling new products and managing a diversified global portfolio. Fluctuations in foreign exchange rates and geopolitical factors in emerging markets also pose risks.
References
- [1] Glenmark Pharmaceuticals Share Price Today Live NSE/BSE - Bajaj Finserv. View Source ↗(Accessed: 2026-08-01)
- [2] Top 10 Pharma Companies in India 2026 — Market Cap, Revenue & Ranking - Bajaj Finserv. View Source ↗(Accessed: 2026-08-01)
- [3] Glenmark Pharmaceuticals Share Price Today - GLENMARK Live Updates NSE/BSE - Dhan. View Source ↗(Accessed: 2026-08-01)
- [4] Glenmark Pharma Share Price today - Live NSE/BSE - Bajaj Broking. View Source ↗(Accessed: 2026-08-01)
- [5] Top 10 Pharma Companies in India 2026: Best Stocks Returns and Risks - Invest Yadnya. View Source ↗(Accessed: 2026-08-01)
- [6] Glenmark Pharmaceuticals Market Cap - NSE - Stock Analysis - Stock Analysis. View Source ↗(Accessed: 2026-08-01)
- [7] Top 10 Pharma Companies in India (2026) — Market Cap - Laafon Galaxy Pharmaceuticals. View Source ↗(Accessed: 2026-08-01)
- [8] Glenmark Pharma Stock Price Today | NSE: GLEN Live - Investing.com. View Source ↗(Accessed: 2026-08-01)
- [9] Glenmark Pharmaceuticals Ltd share price - Screener - Screener.in. View Source ↗(Accessed: 2026-08-01)
- [10] Glenmark Pharma Share Price Today, Glenmark Pharma Stock Price Live NSE/BSE Updates - The Economic Times. View Source ↗(Accessed: 2026-08-01)
- [11] DR REDDYS LABORATORIES Price/Earnings(PE) Ratio-25 Jul,2026 - Smart-Investing.in. View Source ↗(Accessed: 2026-08-01)
- [12] Best Pharma Stocks in India 2026 - Groww. View Source ↗(Accessed: 2026-08-01)
- [13] Glenmark Pharmaceuticals Ltd (GLENMARK) – Q1 FY2026-27 Results Analysis - CompoundingAI. View Source ↗(Accessed: 2026-08-01)
- [14] Glenmark Pharmaceuticals: Board Approves Q1 FY27 Results and Sets Dividend Record Date - InvestyWise. View Source ↗(Accessed: 2026-08-01)
- [15] Glenmark Pharmaceuticals Ltd (GLENMARK) Q1 Results FY27 Preview: Date, Time, Expectations & Key Things To Watch - CompoundingAI. View Source ↗(Accessed: 2026-08-01)
- [16] List of Popular Pharma Sector Stocks to Buy in India 2026 - Bajaj Broking. View Source ↗(Accessed: 2026-08-01)
- [17] Glenmark Pharmaceuticals Ltd. Share/Stock Price Live Today on NSE - ET Money. View Source ↗(Accessed: 2026-08-01)
- [18] Glenmark Pharma Q1 Results: Profit Rises Exponentially To Rs 483 Crore; Revenue Jumps 23% - NDTV Profit. View Source ↗(Accessed: 2026-08-01)
- [19] Cipla Limited Share Price, Chart and Financials - ShareKeyX. View Source ↗(Accessed: 2026-08-01)
- [20] Glenmark Pharma Q1 consolidated revenue rises 23% - Pharmabiz.com. View Source ↗(Accessed: 2026-08-01)
- [21] Dr. Reddy's Laboratories (RDY) - P/E ratio - Companies Market Cap. View Source ↗(Accessed: 2026-08-01)
- [22] Glenmark Pharmaceuticals' revenue rises 15.8% YoY to Rs 3770.6 crore in Q4 FY26 - The Tribune. View Source ↗(Accessed: 2026-08-01)
- [23] Cipla Limited (CIPLA) Market Cap & Net Worth - Stock Analysis. View Source ↗(Accessed: 2026-08-01)
- [24] Cipla Ltd (CIPLA) Stock Price & News - Google Finance. View Source ↗(Accessed: 2026-08-01)
- [25] Lupin Share Price Today - Live NSE: LUPIN Stock Price & Chart - Kotak Neo. View Source ↗(Accessed: 2026-08-01)
- [26] Glenmark Pharma reports muted revenue in Q1 FY26, net profit plummets 86% - ET Pharma. View Source ↗(Accessed: 2026-08-01)
- [27] Lupin 2026 Company Profile: Stock Performance & Earnings - PitchBook. View Source ↗(Accessed: 2026-08-01)
- [28] Management Discussion & Analysis for the Fourth Quarter of FY 2025-26 - Glenmark Pharmaceuticals. View Source ↗(Accessed: 2026-08-01)
- [29] Cipla (NSE:CIPLA) Market Cap & Net Worth - Stock Analysis. View Source ↗(Accessed: 2026-08-01)
- [30] P/E ratio for Cipla (CIPLA.NS) - Companies Market Cap. View Source ↗(Accessed: 2026-08-01)
- [31] P/E ratio for Lupin Limited (LUPIN.NS) - Companies Market Cap. View Source ↗(Accessed: 2026-08-01)
- [32] Glenmark Pharmaceuticals Ltd Key Financial Ratios - India Infoline. View Source ↗(Accessed: 2026-08-01)
- [33] LUPIN Price/Earnings(PE) Ratio-24 Jul,2026 - Smart-Investing.in. View Source ↗(Accessed: 2026-08-01)
- [34] Dr. Reddy's Laboratories (RDY) Stock Chart and Price History 2026 - MarketBeat. View Source ↗(Accessed: 2026-08-01)
- [35] Glenmark posts ₹3900 cr in Q3 FY26, net profit soars 16% - ET Pharma. View Source ↗(Accessed: 2026-08-01)
- [36] Lupin Ltd. Share/Stock Price Live Today on NSE - ET Money. View Source ↗(Accessed: 2026-08-01)
- [37] Glenmark Pharma Reports Q4 & FY25 Financial results - Glenmark Pharmaceuticals. View Source ↗(Accessed: 2026-08-01)
- [38] Glenmark Pharma - Financial Ratios - Trendlyne.com. View Source ↗(Accessed: 2026-08-01)
- [39] Dr Reddys Laboratories Ltd share price | About Dr Reddy's Labs | Key Insights - Screener.in. View Source ↗(Accessed: 2026-08-01)
- [40] GLENMARK PHARMACEUTICALS LTD. Profile - Business Structure, Industry & Snapshot - Tracxn. View Source ↗(Accessed: 2026-08-01)
- [41] Glenmark Pharmaceuticals - ICICI Securities. View Source ↗(Accessed: 2026-08-01)
- [42] Dr. Reddy's Laboratories (RDY) - Market capitalization - Companies Market Cap. View Source ↗(Accessed: 2026-08-01)
- [43] Glenmark Pharmaceuticals Ltd Q2FY26 - Dolat Analysis & Research Theme. View Source ↗(Accessed: 2026-08-01)
- [44] Debt to Equity analysis of Glenmark Pharmaceuticals Ltd., FY Ratio 0.0102 - Top Stock Research. View Source ↗(Accessed: 2026-08-01)
- [45] Glenmark Pharmaceuticals Ltd - StockScans - StockScans. View Source ↗(Accessed: 2026-08-01)
- [46] Total Debt/Equity of GLENMARK PHARMACEUTICALS -Mar2025 - Smart-Investing.in. View Source ↗(Accessed: 2026-08-01)
Disclaimer: IMPORTANT DISCLAIMER: This analysis is generated using artificial intelligence and is NOT a recommendation to purchase, sell, or hold any stock. This analysis is for informational and educational purposes only. Past performance does not guarantee future results. Please consult with a qualified financial advisor before making any investment decisions. The author and platform are not responsible for any investment losses.
Continue Your Investment Journey
Discover more insights that match your interests
Deeptech Unicorns 2025: How Defence, Robotics, and Energy Startups Are Reshaping Investment Valuations
India's startup ecosystem is undergoing a profound transformation, with deep tech—encompassing defence, robotics, and energy—emerging as a key driver of innovation and investment.

India’s Union Budget 2026: Infrastructure Spending Surge, Tax Relief Impacts & Retail Investor Opportunities
India's Union Budget 2026 is poised to be a pivotal moment for the nation's economic trajectory, with experts advocating a massive surge in infrastructure spending to ₹12 lakh crore, building on th...

AI-Powered Unicorns 2025: Why Generative AI Startups Are Reshaping Valuations
The Indian startup ecosystem is witnessing a seismic shift, driven by the rapid rise of generative artificial intelligence (AI) startups.
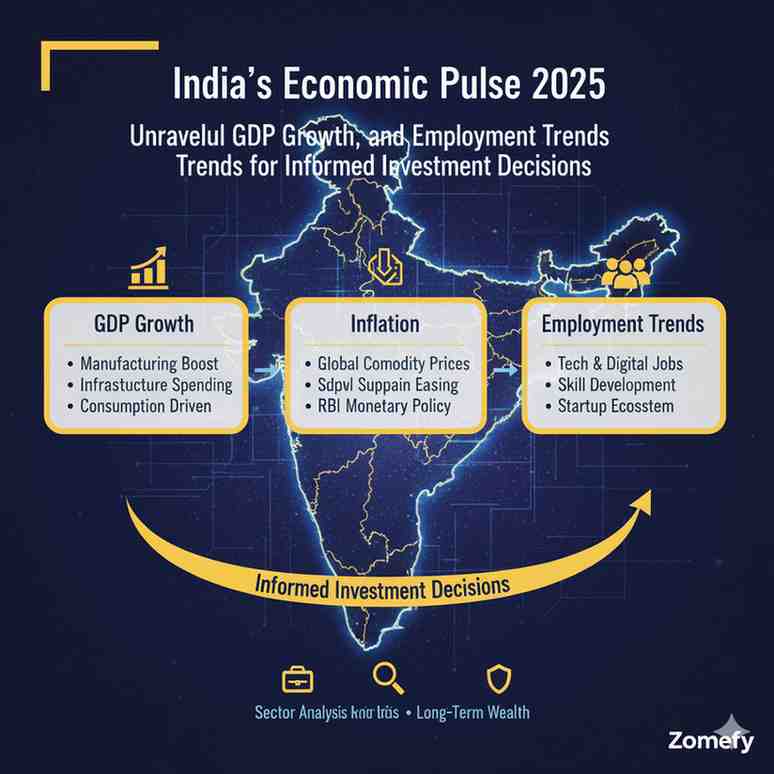
India's Economic Pulse 2025: Unraveling GDP Growth, Inflation, and Employment Trends for Informed Investment Decisions
India's economy in 2025 stands at a pivotal juncture, characterized by robust GDP growth, moderated inflation, and evolving employment trends that collectively shape the investment landscape.
Explore More Insights
Continue your financial education journey