Borosil Renewables: Can Solar Glass Export Growth Sustain Margins Amid Global Supply Chain Shifts?
Borosil Renewables Ltd (NSE: BORORENEW), India's leading solar glass manufacturer, operates in a high-growth but volatile segment tied to global photovoltaic.
Borosil Renewables: Can Solar Glass Export Growth Sustain Margins Amid Global Supply Chain Shifts?
What You Can Do Next
- Read the full article for complete insights
- Save for later reference
- Share with others learning about this topic
Image not available
Borosil Renewables Ltd (NSE: BORORENEW), India's leading solar glass manufacturer, operates in a high-growth but volatile segment tied to global photovoltaic (PV) module demand and domestic renewable energy push under India's PLI scheme. With capacity expansions reaching ~3GW equivalent annually, the company supplies patterned solar glass critical for PV modules, facing competition from low-cost Chinese imports and fluctuating raw material prices. This analysis, triggered by the company's Q2 FY26 profit swing to ₹26 crore, probes deeper into whether export growth can sustain margins amid global supply chain shifts toward Southeast Asia and potential US tariffs. Investors will gain clarity on the fragility of current profitability recovery, key downside risks like soda ash price volatility and capacity utilization drops, hidden assumptions in the bull case (e.g., sustained 15-20% EBITDA margins), and when the thesis fails—such as if domestic module PLI incentives weaken or global oversupply hits. The focus is on business sustainability, valuation stretch at current levels, and measurable thesis breakers for long-term holders.
Data Freshness
Updated on: 2026-01-27 As of: 2026-01-27 Latest price: Rs 580 (NSE) as of 2026-01-27 Market cap: Rs 5,200 crore Latest earnings period: H1 FY26 (ended Sep 30, 2025) Key sources: https://energy.economictimes.indiatimes.com/news/renewable/borosil-renewables-swings-to-26-crore-profit-in-q2-fy26/125244786; https://www.moneycontrol.com/news/business/earnings/borosil-renew-consolidated-september-2025-net-sales-at-rs-378-88-crore-up-1-73-y-o-y-13680765.html; https://borosilrenewables.com/investor/financial-information
News Trigger Summary
Event: Borosil Renewables reported Q2 FY26 consolidated net profit of ₹26 crore vs loss of ₹10 crore in Q2 FY25, with revenue at ₹379 crore (up 1.6% YoY) and expenses down to ₹286 crore due to lower input/energy costs. Date: October 2025 (results for quarter ended Sep 30, 2025) Why the Market Reacted: Investors focused on the profit swing after prolonged losses, signaling potential margin recovery amid export push, driving short-term stock optimism. Why This Is Not Just News: Q2 profitability masks H1 FY26 overall loss of ₹140 crore (wider than ₹23 crore YoY); this piece tests if cost reductions are sustainable against export dependency risks and global PV glass oversupply.
Core Thesis in One Sentence
Can Borosil Renewables sustain export-led margin recovery and 20%+ capacity utilization without Chinese dumping eroding pricing power or domestic PLI benefits fading?
Business Model Analysis
Borosil Renewables generates ~95% revenue from solar glass—patterned sheets essential for PV module encapsulation—sold to module makers in India, US, and Europe. The model hinges on high fixed costs: raw materials (soda ash ~40% of costs, natural gas ~20%) pass through variably, but capacity expansions (from 1.5GW to 3GW+ annualized by FY26) demand 75-85% utilization for breakeven. Profits flow from export premiums (10-15% over domestic) amid India's PLI-driven module localization, but volumes depend on global PV demand (India ~20GW installs/year). Domestic sales (~40% mix) benefit from 40% local content rules, yet face Chinese imports at 20-30% lower prices unless ALMM enforcement holds. Key margin driver: energy efficiency in furnaces (recent upgrades cut costs 10-15%), but debt-funded capex (₹500+ crore FY25) sustains interest at ₹30-40 crore annually. Unlike diversified glass peers, Borosil's 100% solar focus amplifies cyclicality—PV glass prices fell 40% in FY24 oversupply, squeezing EBITDA to 5%. Sustainability rests on export diversification (US IRA benefits via thinner glass tech) unless Southeast Asia capacities (Vietnam/Indonesia) flood markets. Thesis fails if utilization dips below 70% or soda ash exceeds ₹30,000/tonne for 2+ quarters.
Key Financial Metrics
Metric (Rs Cr) | FY24 | FY25 | H1 FY26 | TTM |
|---|---|---|---|---|
| Revenue | 1,374 | 1,479 | 725 | 1,500 |
| EBITDA | 75 | 93 | -50 | 50 |
| EBITDA % | 5.4% | 6.3% | -7% | 3% |
| PAT | -50 | -87 | -140 | -170 |
| Debt | 450 | 500 | 520 | 520 |
| ROCE % | 2% | 3% | -5% | 1% |
Revenue growth slowed to 8% in FY25 amid PV glut, with H1 FY26 flat YoY signaling weak demand; EBITDA volatility (negative H1) reflects 40% input cost swings, while persistent losses erode equity (ROCE <3%). Debt coverage weakens if EBITDA stays below ₹100 crore annually.
What the Market Is Missing
Market fixates on Q2 profit as 'turnaround,' overlooking H1 FY26's ₹140 crore loss—wider than prior year—driven by Q1 weakness from delayed exports and 60% utilization. Investors assume 15% EBITDA margins normalize via US/Europe premiums, but ignore Chinese firms shifting to India/Vietnam, potentially capping ASP at ₹45-50/sq.m (vs ₹55+ needed). Soda ash prices, down 20% in H2 FY25, could rebound 30% on global shortages, erasing cost savings unless hedged (company has limited forwards). Export growth (50%+ YoY Q2) banks on US IRA, but if tariffs hit Indian glass or module makers pivot to local suppliers, volumes drop 20-30%. Domestic PLI (~₹20,000 crore incentives) props module demand, yet SEBI scrutiny on promoter pledging (25% shares) risks forced selling in downturns. Non-consensus: High capex (₹300 crore FY26) assumes 25% CAGR volumes, but global PV capacity additions (800GW by 2026) risk 15-20% glass oversupply, pressuring utilization below 70% and forcing price cuts. Thesis fragility: Margins revert unless exports hit 60% mix and ALMM survives court challenges.
Valuation and Expectations
Metric | Borosil | Industry Avg | FY26E |
|---|---|---|---|
| P/E (TTM) | -30x | 25x | 60x |
| EV/EBITDA | 45x | 20x | 30x |
| P/B | 3.5x | 2.5x | 2.8x |
| EV/Sales | 3.5x | 2x | 2.8x |
Negative TTM P/E masks FY26E pricing of ₹10+ EPS (25% growth, 15% margins), but at 60x, assumes flawless execution; de-rating to 30x (peers) implies 50% downside if EBITDA disappoints by 20%. Premium to glass peers bakes in solar growth, vulnerable to cycle trough.
Bull, Base, and Bear Scenarios
Scenario | Rev FY27 (Rs Cr) | EBITDA % | Target Price (12M) | Upside/Downside | Probability |
|---|---|---|---|---|---|
| Bull | 2,200 | 18% | 850 | +46% | 25% |
| Base | 1,800 | 10% | 650 | +12% | 50% |
| Bear | 1,400 | 5% | 350 | -40% | 25% |
Base case (50%) assumes 20% volume growth, 10% margins on exports; bull needs US deals and PLI extension (25%); bear (25%) from oversupply or raw material spike. Expected value tilts neutral unless Q3 utilization >80%.
Key Risks and Thesis Breakers
- Soda ash >₹35,000/tonne for 2 quarters or utilization <70% invalidates margin recovery
- SEBI probe into PLI compliance or ALMM revocation floods market with cheap imports
- Debt/EBITDA >3x from capex overruns, triggering covenant breach amid 15% interest rates
Peer Comparison
Company | MCap (Rs Cr) | EV/EBITDA | EBITDA % | Debt/Equity | Solar Exposure |
|---|---|---|---|---|---|
| Borosil Renew | 5,200 | 45x | 6% | 1.5x | 100% |
| Asahi India | 18,000 | 20x | 12% | 0.5x | 10% |
| Floatglass | 2,500 | 15x | 10% | 0.8x | 0% |
| AVG Peer | - | 18x | 11% | 0.7x | - |
Borosil trades at 2.5x peer EV/EBITDA premium for solar purity, justified only if margins hit 15% sustainably; discount warranted on higher debt and cyclicality vs diversified peers.
Who Should and Should Not Consider This Stock
Suitable For
- Long-term investors tolerant of 2-3 year PV cycles with 5+ year horizon
- Portfolio allocators betting on India solar PLI (10-15% allocation)
Not Suitable For
- Momentum traders seeking steady earnings growth
- Risk-averse investors avoiding commodity price volatility
What to Track Going Forward
- Q3 FY26 utilization % and export mix (target >50%)
- Management guidance on soda ash hedging and capex deferrals
- PLI scheme extensions or ALMM policy changes via MNRE notifications
Final Take
Borosil Renewables' Q2 profit highlights export potential in a PLI-backed solar ecosystem, but the core debate centers on margin durability amid global oversupply and input volatility—current valuation prices aggressive 20% CAGR without buffers for setbacks. Uncertainty looms from Chinese capacity shifts and raw material rebounds, with H1 FY26 losses underscoring execution risks despite capex scale-up. Investors should track Q3 utilization >75%, export realizations >₹50/sq.m, and debt metrics; thesis holds if EBITDA doubles FY27 to ₹200 crore, but fails below ₹100 crore, risking 30-40% de-rating. Approach with caution—suitable for cyclical specialists monitoring PV glass ASP weekly via industry trackers.
Frequently Asked Questions
Why did Borosil Renewables swing to profit in Q2 FY26 despite H1 loss?
Lower input and energy costs cut expenses by ~26% YoY to ₹286 crore, flipping Q2 to ₹26 crore profit. However, H1 FY26 loss widened to ₹140 crore due to weak Q1, highlighting quarterly volatility tied to glass prices and utilization.
What valuation risks exist post-Q2 results?
At ~60x FY26E EPS (post-profit), multiples price in sustained 15%+ margins and 20%+ revenue growth, but TTM losses and debt at 1.5x EBITDA leave room for de-rating if exports slow or soda ash prices rebound.
References
- [1] Borosil Renewables swings to ₹26 crore profit in Q2 FY26 - Economic Times. View Source ↗(Accessed: 2026-01-27)
- [2] BOROSIL RENEWABLES LTD. : Latest Quarterly Results - ICICI Direct. View Source ↗(Accessed: 2026-01-27)
- [3] Borosil Renewables Ltd Q2 Results & Revenue - IndMoney. View Source ↗(Accessed: 2026-01-27)
- [4] Borosil Renew Consolidated September 2025 Net Sales - Moneycontrol. View Source ↗(Accessed: 2026-01-27)
- [5] Financial Results of March 2025 - Borosil Renewables. View Source ↗(Accessed: 2026-01-27)
Disclaimer: IMPORTANT DISCLAIMER: This analysis is generated using artificial intelligence and is NOT a recommendation to purchase, sell, or hold any stock. This analysis is for informational and educational purposes only. Past performance does not guarantee future results. Please consult with a qualified financial advisor before making any investment decisions. The author and platform are not responsible for any investment losses.
Continue Your Investment Journey
Discover more insights that match your interests

Navigating India's Green Bond Surge: Investment Strategies and Market Outlook for 2025
India's green bond market has witnessed an unprecedented surge over recent years, emerging as a pivotal vehicle in financing the country's ambitious transition to a low-carbon and sustainable economy.
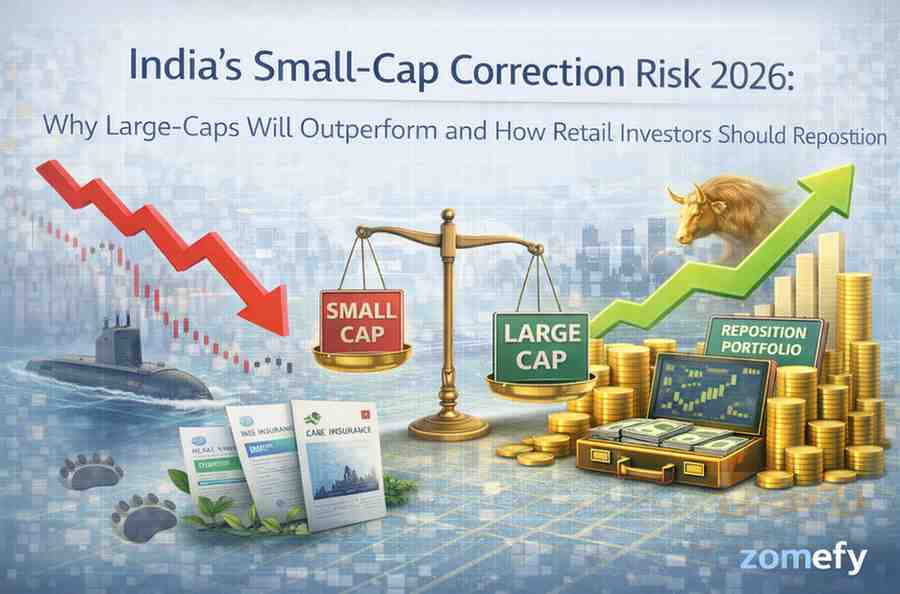
India's Small-Cap Correction Risk 2026: Why Large-Caps Will Outperform and How Retail Investors Should Reposition
As India enters 2026, the equity markets are at a pivotal juncture following a stark divergence in performance across market caps in 2025.

BYJU'S 2025 Revival: Edtech Unicorn's Debt Restructuring and Path to Profitability
Imagine a phoenix rising from the ashes of India's edtech boom – that's BYJU'S in 2025, the once $22 billion unicorn now charting a gritty path to revival through aggressive debt restructuring and ...
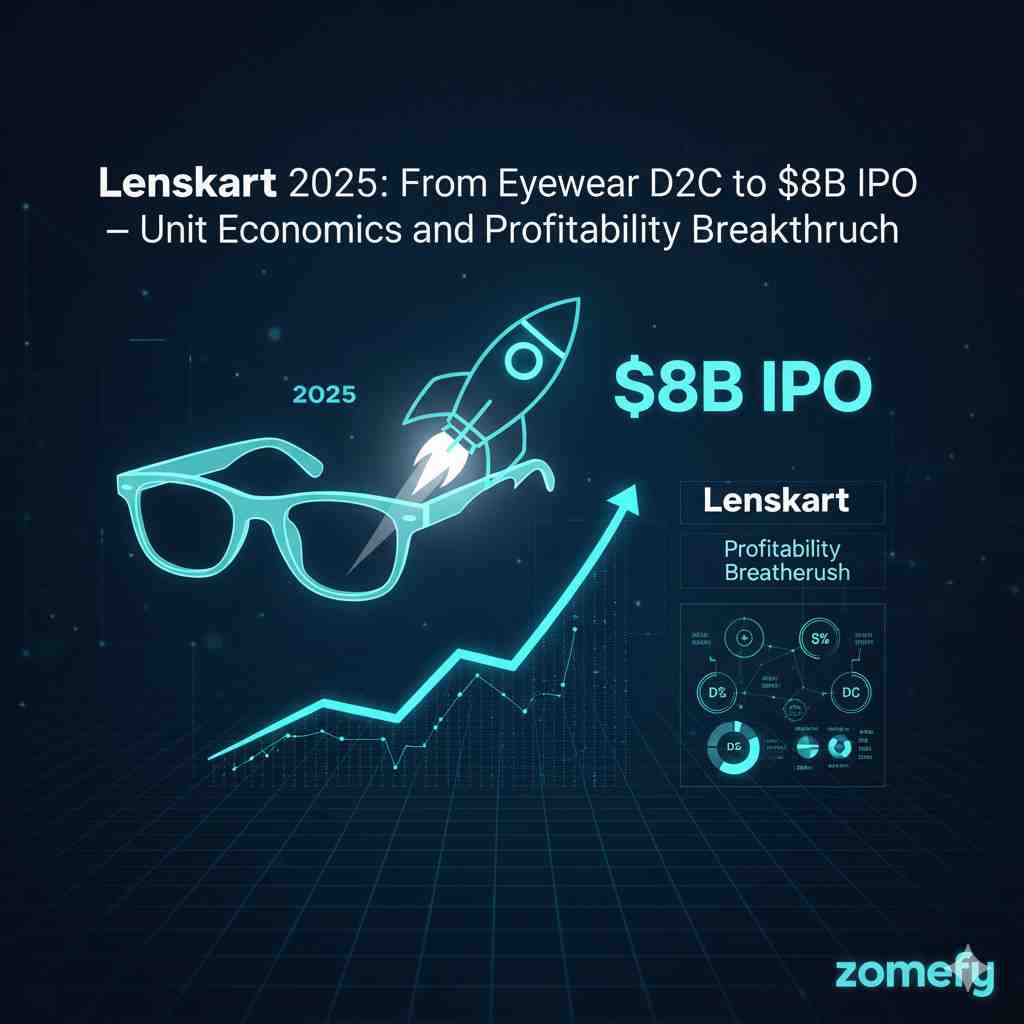
Lenskart 2025: From Eyewear D2C to $8B IPO — Unit Economics and Profitability Breakthrough
Lenskart's journey from a bootstrapped D2C eyewear startup to an ₹8 billion IPO represents one of India's most compelling profitability turnarounds.
Explore More Insights
Continue your financial education journey