Apollo Tyres: Can Global Expansion and Raw Material Volatility Impact Long-Term Margin Stability?
Apollo Tyres, a prominent player in the Indian and global tyre industry, recently captured investor attention with its robust Q4 FY26 results and ambitious.
Apollo Tyres: Can Global Expansion and Raw Material Volatility Impact Long-Term Margin Stability?
What You Can Do Next
- Read the full article for complete insights
- Save for later reference
- Share with others learning about this topic
Image not available
Apollo Tyres, a prominent player in the Indian and global tyre industry, recently captured investor attention with its robust Q4 FY26 results and ambitious capital expenditure plans for the upcoming fiscal year. While the headline numbers, particularly the significant jump in net profit and expansion initiatives in India and Europe, paint an optimistic picture, a deeper dive reveals underlying complexities. This article aims to move beyond the immediate news cycle to scrutinize the sustainability of Apollo Tyres' global expansion strategy, the persistent challenge of raw material price volatility, and the potential impact of these factors on long-term margin stability. For Indian retail investors, understanding not just the growth narrative but also the inherent risks and the conditions under which the investment thesis might falter is paramount for informed decision-making.
Data Freshness
Updated on: 2026-06-02 As of: 2026-06-02 Latest price: Rs 383.95 (NSE) as of June 2, 2026, 9:54 a.m. IST Market cap: Rs 24,455 crore (approx.) Latest earnings period: FY26 Q4 (ended March 31, 2026) Key sources: https://in.investing.com/equities/apollo-tyres-ltd-financial-summary; https://www.business-standard.com/companies/quarterly-results/apollo-tyres-ltd-quarterly-results-126060100001_1.html; https://economictimes.indiatimes.com/apollo-tyres-ltd/stocks/companyid-10499.cms
News Trigger Summary
Event: Apollo Tyres announced its Q4 FY26 and full-year FY26 financial results, alongside a significant capital expenditure plan for FY27 focused on capacity expansion in India and Europe, particularly Hungary. The company also confirmed the closure of its Dutch plant, leading to restructuring costs, and acknowledged ongoing raw material cost volatility. Date: Q4 FY26 results were reported around May 14-18, 2026. Details of the FY27 capex plan were reiterated in investor updates around May 19-21, 2026. Why the Market Reacted: The market reacted to the strong Q4 FY26 consolidated net profit, which jumped 241.77% year-on-year to Rs 630.97 crore, and the ambitious growth-oriented capital expenditure of Rs 3,500 crore for FY27. However, investors are also weighing the implications of persistent raw material price volatility and the one-time charges associated with the European restructuring on future margins. Why This Is Not Just News: While the recent earnings and capex announcements provide a snapshot, this article delves deeper into the long-term viability of Apollo Tyres' global expansion strategy, the structural challenges posed by raw material price fluctuations, and whether the current valuation fully accounts for these inherent risks and the execution challenges of such large-scale investments. It aims to provide an evergreen perspective on the company's fundamental drivers and potential vulnerabilities, rather than merely summarizing recent headlines.
Core Thesis in One Sentence
Apollo Tyres' ambitious global expansion and domestic capacity additions, while signaling growth, face significant headwinds from persistent raw material price volatility and intense competition, potentially challenging its long-term margin stability and return on capital.
Business Model Analysis
Apollo Tyres operates as an international tyre manufacturer, generating revenue from the sale of automotive tyres, tubes, and flaps for a diverse range of vehicles including commercial, passenger vehicles, two-wheelers, and off-highway vehicles. The company primarily operates under two global brands: Apollo and Vredestein. Its manufacturing footprint extends across India (five units), the Netherlands, and Hungary. As of 2024, approximately 87% of its revenues originated from India, with 11% from Europe, highlighting a strong domestic reliance despite international presence. The business model is largely driven by two key segments: Original Equipment Manufacturers (OEMs) and the Replacement market. The replacement market typically offers higher margins and contributes significantly to overall sales, driven by the existing vehicle parc and usage patterns. The OEM segment, while crucial for brand visibility and initial fitment, is often more price-sensitive. Profitability is highly sensitive to raw material costs, primarily natural rubber and crude oil derivatives (synthetic rubber, carbon black), which constitute a substantial portion of the cost of goods sold. The company's strategy involves increasing capacity in high-growth segments like Passenger Car Radials (PCR) and Truck and Bus Radials (TBR) in India, and passenger car tyres in Europe, to cater to rising demand and improve market share. Global expansion, particularly in Europe, aims to diversify revenue streams and leverage premium brands like Vredestein. However, this also exposes the company to international trade policies, currency fluctuations, and varying competitive landscapes. The recent closure of its Dutch plant and consolidation of European manufacturing in Hungary indicates a strategic shift towards optimizing its international operations for better efficiency. The company also focuses on R&D for sustainable materials to mitigate raw material price volatility and enhance product offerings.
Key Financial Metrics
Metric (Rs crore) | FY23 | FY24 | FY25 | FY26 |
|---|---|---|---|---|
| Revenue from Operations | 24,568 | 25,378 | 26,123 | 28,471 |
| Operating Profit (EBITDA) | 3,016 | 4,447 | 3,572 | 4,147 |
| Net Profit | 1,722 | 1,722 | 1,121 | 1,372 |
| Operating Margin (%) | 12.28% | 17.52% | 13.67% | 14.57% |
| Net Profit Margin (%) | 7.01% | 6.79% | 4.29% | 4.82% |
| ROCE (%) | 12.5% (approx) | 13.5% (approx) | 13.8% | 13.4% |
| Net Debt/EBITDA | N/A | 0.8x (Q2 FY25) | N/A | 0.4x |
Apollo Tyres has demonstrated consistent revenue growth, with FY26 revenue reaching Rs 28,471 crore, up 9% year-on-year. However, the trajectory of profitability has been more volatile. Operating profit (EBITDA) saw a significant decline in FY25 to Rs 3,572 crore from Rs 4,447 crore in FY24, reflecting margin pressures. This led to a sharp drop in Net Profit in FY25 to Rs 1,121 crore, a 35% decline year-on-year. FY26 saw a recovery in Net Profit to Rs 1,372 crore and an improvement in operating margins to 14.57%, partly due to a strong Q4 FY26 performance (Q4 Net Profit up 241.77% YoY to Rs 630.97 crore) and possibly a more favorable raw material environment in parts of the year. The consolidated Return on Capital Employed (ROCE) has hovered in the 13-14% range, with FY26 at 13.4%, indicating a reasonable but not exceptional efficiency in capital deployment. A notable positive is the improvement in Net Debt/EBITDA to 0.4x by March 2026, suggesting a strengthening balance sheet and reduced leverage, which is crucial given the planned large-scale capital expenditures.
What the Market Is Missing
The market's current optimism around Apollo Tyres often centers on its robust Q4 FY26 earnings and the ambitious capacity expansion plans. However, what might be understated is the persistent and cyclical nature of raw material volatility, particularly natural rubber and crude oil derivatives. While the company has shown resilience in certain quarters, the industry has historically struggled to fully pass on cost increases in a competitive environment, leading to margin compression. Investors may be underestimating the potential for a sustained period of elevated raw material costs, which could quickly erode the benefits of increased volumes from new capacities. Furthermore, the global expansion strategy, while diversifying revenue, introduces new layers of risk. The European market, for instance, faces its own macroeconomic uncertainties, and the recent closure of the Dutch plant, while a streamlining effort, comes with one-time restructuring costs that will weigh on near-term profitability. The assumption that 'full capacity utilization' will automatically translate to higher profits might be fragile if demand softens in key international markets or if intense competition, including potential dumping of cheap tyres from China due to US tariffs, restricts pricing power. The market may also be overlooking the execution risks inherent in a Rs 3,500 crore capex plan for FY27, which requires precise project management, timely commissioning, and successful market absorption of additional output without significant price erosion. The success of this investment hinges on sustained strong demand and a benign raw material environment, both of which are highly cyclical and unpredictable in the tyre industry.
Valuation and Expectations
Metric | Apollo Tyres (FY26 TTM) | Industry Median |
|---|---|---|
| P/E Ratio | 17.80 - 18.25x | 21.64x (approx) |
| P/B Ratio | 1.46 - 1.5x | N/A |
| EV/EBITDA | N/A | N/A |
| Dividend Yield (%) | 1.32% - 1.56% | N/A |
| EPS (Rs) | 21.65 - 21.66 | N/A |
Apollo Tyres currently trades at a P/E ratio of approximately 17.80x to 18.25x (TTM FY26), which is slightly below the industry median of around 21.64x as of May 29, 2026. This suggests that the market is pricing in a reasonable growth trajectory, but perhaps with some discount for the inherent cyclicality and raw material risks. The P/B ratio of 1.46x to 1.5x indicates that the stock is trading at a modest premium to its book value. The current valuation appears to price in expectations of continued revenue growth, driven by domestic demand and the benefits of new capacity. However, it also implicitly assumes that the company will be able to manage raw material costs effectively and maintain or slightly improve its operating margins from the FY26 levels. Any significant and prolonged increase in raw material prices that cannot be passed on to consumers, or a slowdown in demand, could lead to a re-rating of these expectations. The market is not currently assigning a significant 'growth premium' that would imply a frictionless path to higher profitability from global expansion. Instead, it seems to reflect a cautious optimism, balancing growth potential with known industry challenges.
Bull, Base, and Bear Scenarios
Scenario | Key Assumptions | Revenue (FY27E, Rs crore) | EBITDA Margin (FY27E, %) | Net Profit (FY27E, Rs crore) |
|---|---|---|---|---|
| Bull Case | Strong domestic & export demand, stable/declining raw material prices, successful capex execution, effective cost pass-through. | 32,000 - 33,000 | 15.5% - 16.5% | 1,800 - 2,000 |
| Base Case | Moderate domestic demand, gradual raw material price stabilization, some pricing power, decent capex utilization. | 30,000 - 31,000 | 14.0% - 15.0% | 1,450 - 1,650 |
| Bear Case | Sharp rise in raw material costs, intense competition limiting price hikes, global demand slowdown, capex delays/underutilization, significant restructuring charges. | 28,500 - 29,500 | 11.0% - 12.0% | 800 - 1,000 |
The Bull Case assumes a confluence of favorable factors: robust demand across India and key European markets, coupled with either stable or declining raw material costs. This allows Apollo Tyres to fully leverage its expanded capacity and pass on any residual cost increases, leading to margin expansion and strong profit growth. The probability of this scenario is considered moderate, given the inherent cyclicality of raw materials. The Base Case reflects a more realistic outlook, where domestic demand remains steady, raw material prices stabilize gradually, and the company maintains some pricing power. Capacity utilization from new investments is expected to be decent, leading to moderate revenue and profit growth. This is currently viewed as the most probable outcome. The Bear Case envisions a challenging environment marked by a sharp, sustained increase in raw material prices that the company cannot fully absorb or pass on. This, combined with a slowdown in global demand and intensified competition (potentially from dumped imports), could lead to significant margin erosion and underutilization of new capacities. Delays in capex or higher-than-expected restructuring costs could further exacerbate the downside. The probability of this scenario, while lower than the base case, cannot be ignored given the industry's history of volatility. Investors should weigh these outcomes against the current valuation.
Key Risks and Thesis Breakers
Peer Comparison
Company | Market Cap (Rs crore) | P/E (TTM) | P/B (TTM) | ROCE (FY25/FY26) | ROE (FY25/FY26) |
|---|---|---|---|---|---|
| Apollo Tyres Ltd. | 24,455 | 17.80x | 1.46x | 13.4% | N/A |
| MRF Ltd. | 54,567 | 50.0x (approx) | N/A | N/A | N/A |
| Balkrishna Industries Ltd. | 42,856 | N/A | N/A | N/A | N/A |
| CEAT Ltd. | 13,475 | 40.64x | 1.49x | 23.34% | 18.76% |
| JK Tyre & Industries Ltd. | 11,142 | 41.83x | N/A | 12.37% | 10.91% |
Compared to its larger peer MRF, Apollo Tyres trades at a significantly lower P/E multiple, reflecting MRF's premium valuation often attributed to its market leadership and brand equity, despite lower liquidity. Against CEAT and JK Tyre, Apollo Tyres' P/E of 17.80x is considerably more attractive than CEAT's 40.64x and JK Tyre's 41.83x, suggesting that the market is either pricing in lower growth expectations or a higher risk premium for Apollo. However, CEAT's higher ROCE and ROE (23.34% and 18.76% respectively for FY25/FY26) indicate potentially better capital efficiency than Apollo's 13.4% ROCE. Apollo's lower valuation multiples might be justified if the market perceives greater exposure to raw material volatility or higher execution risk in its global expansion. However, if Apollo can successfully integrate its European operations, manage raw material costs through diversification and sustainable materials, and effectively utilize its new capacities, there could be a case for valuation convergence with more efficiently run peers in the future.
Who Should and Should Not Consider This Stock
Suitable For
Not Suitable For
What to Track Going Forward
Final Take
Apollo Tyres presents a compelling case for growth, underpinned by its aggressive domestic and international capacity expansion plans and a strengthening balance sheet with a low net debt to EBITDA. The recent Q4 FY26 results underscore the company's ability to capitalize on favorable market conditions and operational efficiencies. However, investors should approach this opportunity with a clear understanding of the inherent risks. The tyre industry remains deeply cyclical, with profitability highly susceptible to the volatile prices of natural rubber and crude oil. While Apollo is exploring sustainable materials, their impact on cost stability is a long-term play, not a near-term solution. The success of its global expansion, particularly in Europe, will depend on navigating complex macroeconomic environments and competitive pressures, with the recent Dutch plant closure highlighting the challenges of international operations. The current valuation, while appearing attractive compared to some peers, implicitly prices in a degree of execution success and margin resilience. A failure to effectively manage raw material costs or slower-than-anticipated demand absorption for new capacities could lead to earnings disappointment. For long-term investors, Apollo Tyres is a 'monitor closely' stock, where the ability of management to execute on its ambitious plans amidst cyclical headwinds and maintain pricing discipline will be critical to unlocking sustainable value.
Frequently Asked Questions
What is driving Apollo Tyres' recent performance and expansion plans?
Apollo Tyres' Q4 FY26 performance was boosted by strong demand in India, particularly in the replacement and OEM segments, and a favorable tax regime adoption from FY27. The company is undertaking a significant capital expenditure of Rs 3,500 crore in FY27, primarily to expand passenger car radial (PCR) and truck and bus radial (TBR) capacity in India and passenger car tyre production in Hungary, driven by high capacity utilization rates.
What are the key risks to Apollo Tyres' long-term margin stability?
Long-term margin stability faces significant risks from sustained volatility in natural rubber and crude oil-linked raw material prices, which the company may struggle to fully pass on due to competitive market conditions. Additionally, the execution risks associated with large-scale global capacity expansion and the one-time restructuring costs from the Dutch plant closure could impact profitability in the near to medium term.
References
- [1] Apollo Tyres Ltd Stock Price Today | NSE: APLO Live - Investing.com - Investing.com. View Source ↗(Accessed: 2026-06-02)
- [2] Apollo Tyres Ltd Quarterly Results, 01 Jun 2026 - NSE 385.30, BSE 387.00 - Business Standard. View Source ↗(Accessed: 2026-06-02)
- [3] Apollo Tyres Share Price - Stocks - The Economic Times - Indiatimes - The Economic Times. View Source ↗(Accessed: 2026-06-02)
- [4] Apollo Tyres Ltd (APOLLOTYRE) Stock Price & News - Google Finance - Google Finance. View Source ↗(Accessed: 2026-06-02)
- [5] Apollo Tyres Ltd share price - Screener - Screener.in. View Source ↗(Accessed: 2026-06-02)
- [6] Apollo Tyres Ltd. Share Price Today - Stocks - Value Research - Value Research. View Source ↗(Accessed: 2026-06-02)
- [7] Apollo Tyres (APOLLOTYRE.NS) - Market capitalization - Companies Market Cap - Companies Market Cap. View Source ↗(Accessed: 2026-06-02)
- [8] APOLLO TYRES LTD. : Latest Quarterly Results Analysis - ICICI Direct - ICICI Direct. View Source ↗(Accessed: 2026-06-02)
- [9] India's Tyre Industry Eyes 6-8% Growth in FY2026 Despite Export Challenges - Conclave TechMedia Group - Conclave TechMedia Group. View Source ↗(Accessed: 2026-06-02)
- [10] Indian Tyre Industry Set for 7-8% Revenue Growth in FY26 Amid Trade Risks, ETAuto - ETAuto. View Source ↗(Accessed: 2026-06-02)
- [11] India Tyre Market Size, Competitors & Forecast to 2034 - Mordor Intelligence. View Source ↗(Accessed: 2026-06-02)
- [12] India Tyre Market: Industry Size, Share, Top Companies 2034 - IMARC Group - IMARC Group. View Source ↗(Accessed: 2026-06-02)
- [13] Apollo Tyres pressing ahead with India, Europe expansion plans - European Rubber Journal. View Source ↗(Accessed: 2026-06-02)
- [14] India Tyre Manufacturers Market Size, Share, Growth 2035 - Market Research Future - Market Research Future. View Source ↗(Accessed: 2026-06-02)
- [15] Apollo Tyres Live Share Price Today, Share Analysis and Chart - Trendlyne.com - Trendlyne.com. View Source ↗(Accessed: 2026-06-02)
- [16] Apollo Tyres Plans INR 8 Billion Capex in FY26 to Expand Passenger Car Tyre Capacity - Tyrepress.com. View Source ↗(Accessed: 2026-06-02)
- [17] Apollo Tyres (APOLLOTYRE) Investor Relations, Earnings Summary & Outlook - Quartr - Quartr.com. View Source ↗(Accessed: 2026-06-02)
- [18] Apollo Tyres Reports 3% Revenue Growth in FY25 | Autocar Professional - Autocar Professional. View Source ↗(Accessed: 2026-06-02)
- [19] Apollo Tyres Limited Reports Earnings Results for the Fourth Quarter and Full Year Ended March 31, 2026 | MarketScreener - MarketScreener. View Source ↗(Accessed: 2026-06-02)
- [20] APOLLO TYRES 2024-25 Annual Report Analysis - Equitymaster - Equitymaster. View Source ↗(Accessed: 2026-06-02)
- [21] Apollo Tyres FY25 Revenue Rises 3%, Net Profit Falls 35% – Strategic Revamp Ahead - Tyre Times. View Source ↗(Accessed: 2026-06-02)
- [22] Apollo Tyres Q1 Results 2026 - Mint - Livemint. View Source ↗(Accessed: 2026-06-02)
- [23] Apollo Tyres to invest Rs. 4000 crores for production capacity expansion - Motorindia - Motorindia. View Source ↗(Accessed: 2026-06-02)
- [24] Apollo Tyres - Quarterly Results - Trendlyne.com - Trendlyne.com. View Source ↗(Accessed: 2026-06-02)
- [25] Apollo Tyres Commits ₹3,500 Crore to Expansion Amid Raw Material Pressure and European Restructuring - Non-GAAP Earnings - Non-GAAP Earnings. View Source ↗(Accessed: 2026-06-02)
- [26] Apollo Tyres to invest INR 30 billion into India tire capacity - MarkLines - MarkLines Automotive Industry Portal. View Source ↗(Accessed: 2026-06-02)
- [27] Apollo Tyres to invest ₹5810 crore to expand Andhra Pradesh plant capacity - ET Auto - ETAuto. View Source ↗(Accessed: 2026-06-02)
- [28] Apollo Tyres Ltd. - Stocks - The Economic Times - The Economic Times. View Source ↗(Accessed: 2026-06-02)
- [29] Muthoot Finance Q4 FY26 Results | Apollo Tyres Q4 FY26 Results | Top Buzzing Stocks Today - Indian Stock Market News - Equitymaster - Equitymaster. View Source ↗(Accessed: 2026-06-02)
- [30] Apollo Tyres Consolidated Financials 2025 | PDF | Working Capital | Investing - Scribd - Scribd. View Source ↗(Accessed: 2026-06-02)
- [31] Apollo Tyres Peer Comparison - Competition Analysis - Angel One - Angel One. View Source ↗(Accessed: 2026-06-02)
- [32] Q4 & FY25 results - Apollo Tyres Corporate - Apollo Tyres Corporate. View Source ↗(Accessed: 2026-06-02)
- [33] Apollo Tyres explores sustainable materials to cut costs, reduce impact - Primus Partners - Primus Partners. View Source ↗(Accessed: 2026-06-02)
- [34] Apollo Tyres' net profit drops 32% due to rising raw material costs - ET Auto - ETAuto. View Source ↗(Accessed: 2026-06-02)
- [35] Apollo Tyres - Competitors/Peers Analysis - Trendlyne.com. View Source ↗(Accessed: 2026-06-02)
- [36] Apollo Tyres Q4 FY26 Earnings Conference Call | Concall.in - YouTube - Concall.in. View Source ↗(Accessed: 2026-06-02)
- [37] Apollo Tyres Q4 Results - Mint - Livemint. View Source ↗(Accessed: 2026-06-02)
- [38] Raw materials costs, sluggish OE demand weigh on Apollo Tyres earnings - European Rubber Journal. View Source ↗(Accessed: 2026-06-02)
- [39] Apollo Tyres Competitor Peer Analysis 2026 | Choice - Choiceindia.com - Choiceindia.com. View Source ↗(Accessed: 2026-06-02)
- [40] Apollo Tyres Tightens Belt, Capex Below Target as Profitability Takes Center Stage - Non-GAAP Earnings. View Source ↗(Accessed: 2026-06-02)
Disclaimer: IMPORTANT DISCLAIMER: This analysis is generated using artificial intelligence and is NOT a recommendation to purchase, sell, or hold any stock. This analysis is for informational and educational purposes only. Past performance does not guarantee future results. Please consult with a qualified financial advisor before making any investment decisions. The author and platform are not responsible for any investment losses.
Continue Your Investment Journey
Discover more insights that match your interests

Havells India Stock Analysis 2025: Q3 Earnings Beat & Promoter Buying Ignite Consumer Durables Rally
Havells India Limited, a leading player in the electrical equipment and consumer durables sector, has emerged as a focal point for investors following its Q3 FY2025-26 performance and strategic cap...
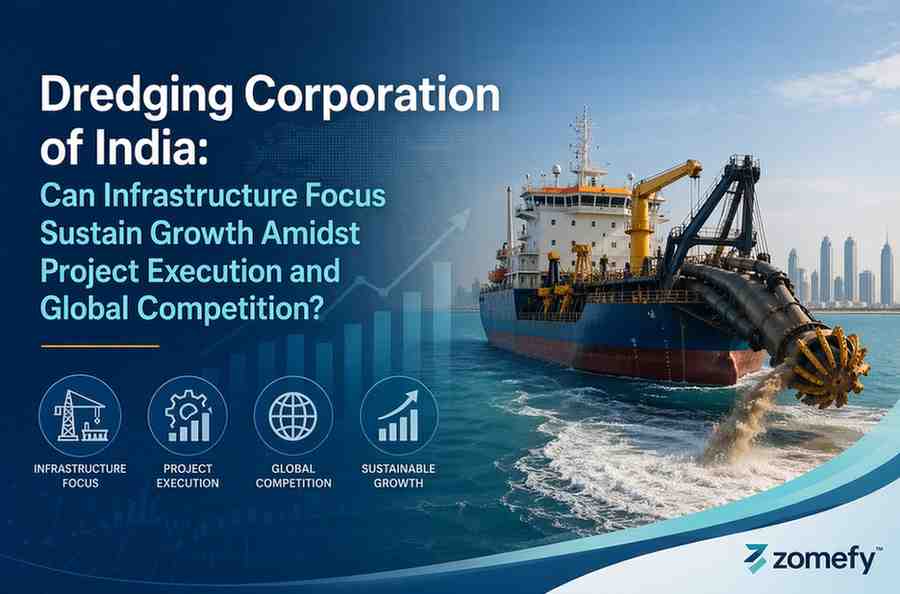
Dredging Corporation of India: Can Infrastructure Focus Sustain Growth Amidst Project Execution and Global Competition?
Dredging Corporation of India (DCI) is a crucial public sector undertaking, vital for maintaining and developing India's extensive coastline, ports, and inland waterways.
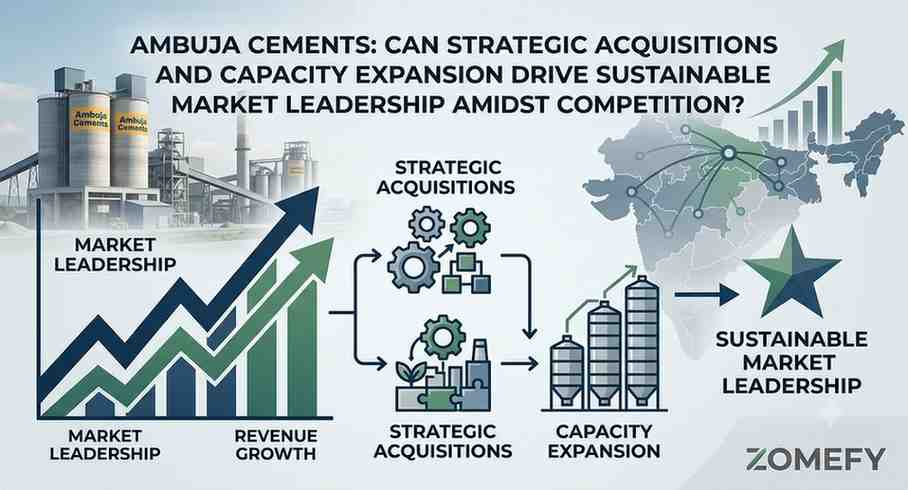
Ambuja Cements: Can Strategic Acquisitions and Capacity Expansion Drive Sustainable Market Leadership Amidst Competition
Ambuja Cements, a prominent player in the Indian cement industry and part of the Adani Group, finds itself at a pivotal juncture.
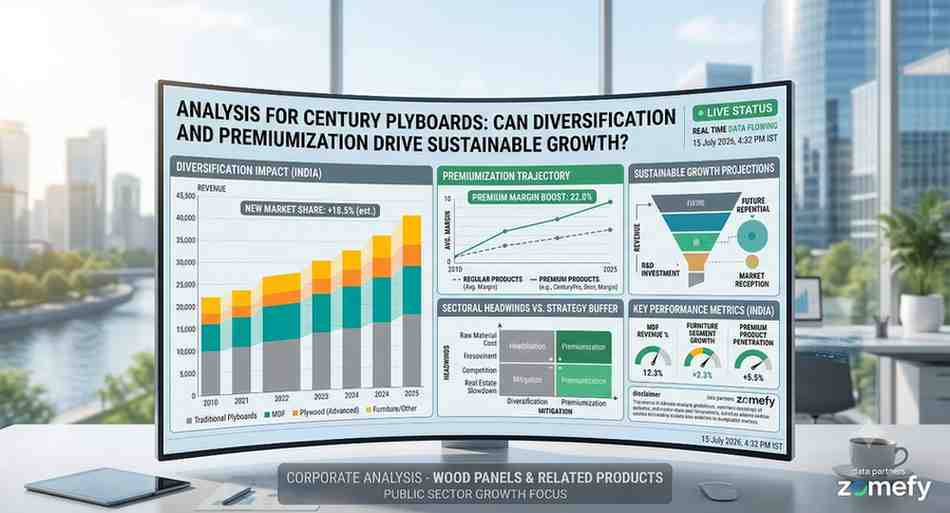
Century Plyboards: Can Diversification and Premiumization Drive Sustainable Growth Amidst Sectoral
Century Plyboards (India) Ltd.
Explore More Insights
Continue your financial education journey