Master Your Money,Navigate the Market
Featured Articles
Our most comprehensive and trending analysis


Latest Articles
Discover our most recent and trending investment insights

Greenpanel Industries: Can Capacity Expansion and Product Mix Shift Drive Margin Resilience?
Greenpanel Industries, a prominent player in India's wood panel industry, has been on the radar of retail investors due to its leadership position in the Medium Density Fibreboard (MDF) segment.

Groww: Can Fintech Diversification and User Growth Sustain Profitability Amidst Regulatory Scrutiny?
Angel One, a prominent player in India's rapidly expanding retail brokerage landscape, has garnered significant attention from investors due to its impressive client acquisition rates and diversifi...

Seshaasai Technologies: Can Payment Card Dominance and IoT Diversification Drive Sustainable Growth?
Seshaasai Technologies, a prominent player in India's payment solutions and communication services sector, has garnered attention for its strong position in the payment card manufacturing space and...

Apollo Micro Systems: Can Defense Sector Acquisitions Drive Sustained Growth and Market Leadership?
Apollo Micro Systems (AMS) is an Indian defense and aerospace technology company that has recently captured market attention, not just through its consistent operational performance but also via st...

Gujarat Fluorochemicals: Can NOC for Composite Scheme Drive Sustainable Value Creation Amidst Sectoral Head
Gujarat Fluorochemicals (GFL) has long been a significant player in India's specialty chemicals landscape, leveraging its deep expertise in fluorine chemistry.

Divine Hira Jewellers: Can Bonus Issues and Stock Splits Sustain Investor Interest Amidst Valuation Deb
Genus Power Infrastructures Ltd.

Indian Bank: Can Asset Quality Improvement Drive Sustained Lending Growth and Valuation Re-rating?
Indian Bank, a prominent public sector lender, has recently captured market attention with its robust Q1 FY27 results, signaling continued improvements in asset quality and sustained lending growth.
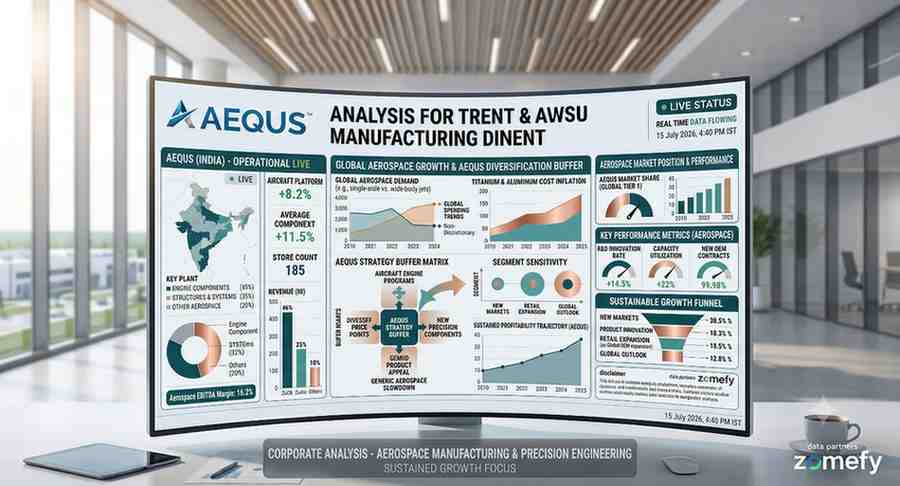
Aequs: Can Aerospace Manufacturing Diversification Drive Sustained Profitability Amidst Global
Hindustan Aeronautics Limited (HAL), a cornerstone of India's aerospace and defense industrial complex, has historically been synonymous with national security, primarily serving the Indian Armed F...
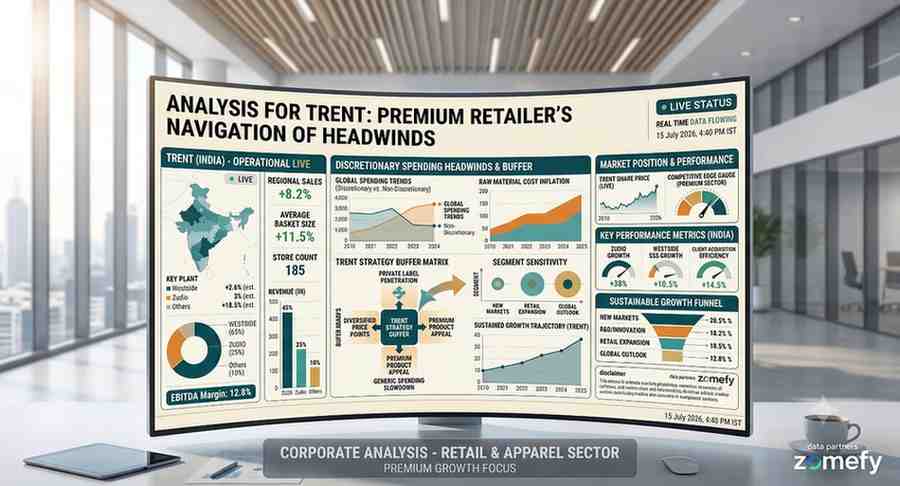
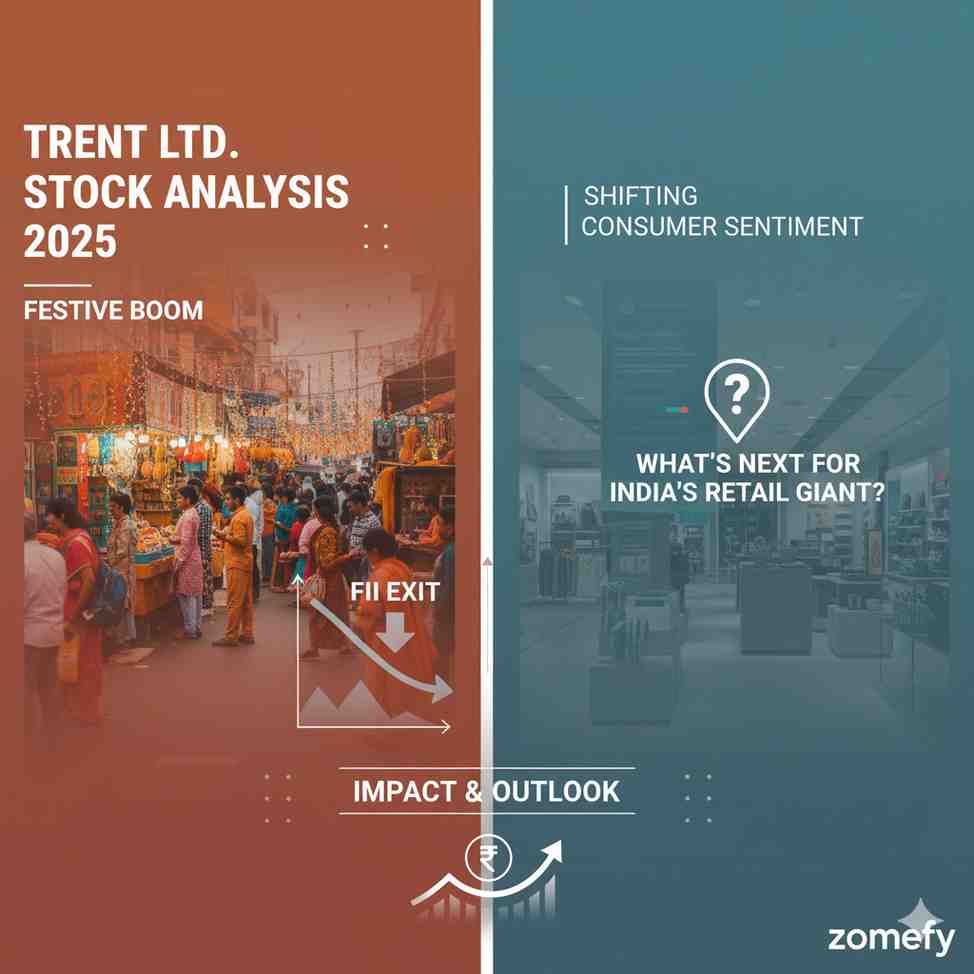
Trent: Can Premium Retailer Navigate Discretionary Spending Headwinds and Sustain Growth Momentum?
Trent Limited, a prominent Tata Group retailer, has carved a significant niche in India's burgeoning fashion and lifestyle segment through its distinct brands like Westside and the rapidly expandin...
Latest Articles by Category
Explore our latest and most popular articles across all categories
Equity Research
AI-generated stock analysis focusing on trending stocks in the news with fundamental analysis and investment insights
Greenpanel Industries: Can Capacity Expansion and Product Mix Shift Drive Margin Resilience?
Greenpanel Industries, a prominent player in India's wood panel industry, has been on the radar of retail investors due to its leadership position in the Medium Density Fibreboard (MDF) segment.
Groww: Can Fintech Diversification and User Growth Sustain Profitability Amidst Regulatory Scrutiny?
Angel One, a prominent player in India's rapidly expanding retail brokerage landscape, has garnered significant attention from investors due to its impressive client acquisition rates and diversifi...
Seshaasai Technologies: Can Payment Card Dominance and IoT Diversification Drive Sustainable Growth?
Seshaasai Technologies, a prominent player in India's payment solutions and communication services sector, has garnered attention for its strong position in the payment card manufacturing space and...
Apollo Micro Systems: Can Defense Sector Acquisitions Drive Sustained Growth and Market Leadership?
Apollo Micro Systems (AMS) is an Indian defense and aerospace technology company that has recently captured market attention, not just through its consistent operational performance but also via st...
Financial Insights
Deep analytical content covering financial history, market trends, and investment perspectives with lasting value

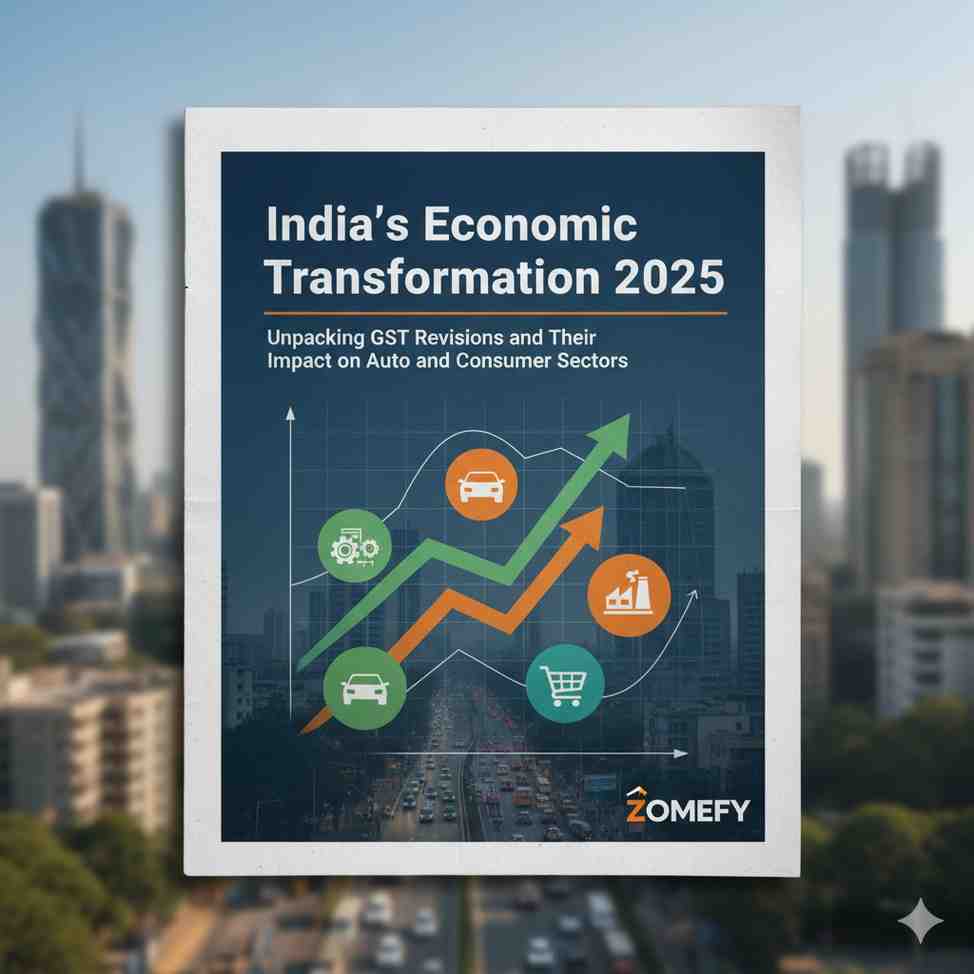
India’s Union Budget 2026: Infrastructure Spending Surge, Tax Relief Impacts & Retail Investor Opportunities
India's Union Budget 2026 is poised to be a pivotal moment for the nation's economic trajectory, with experts advocating a massive surge in infrastructure spending to ₹12 lakh crore, building on th...
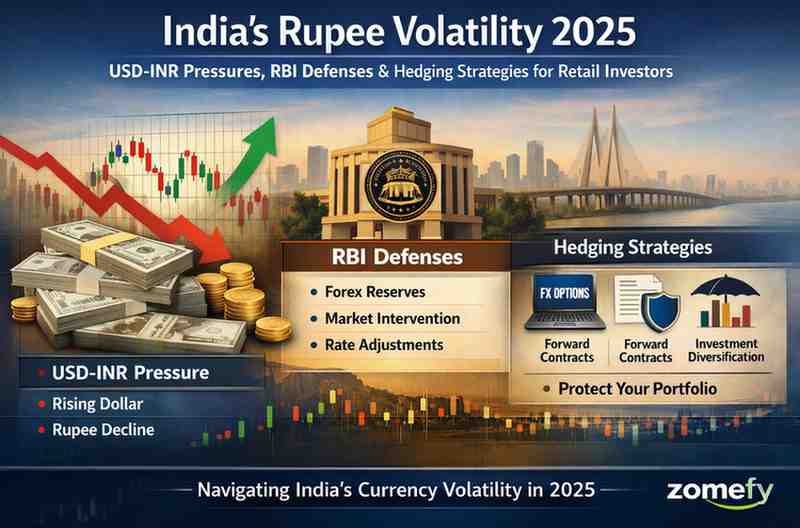
India’s Rupee Volatility 2025: USD-INR Pressures, RBI Defenses & Hedging Strategies for Retail Investors
The Indian Rupee (INR) experienced unprecedented volatility in 2025, breaching the 91 per USD mark for the first time amid US tariffs, record FII outflows of $18 billion, and restrained RBI interve...

India’s AI-Driven Fintech Revolution 2025: Cross-Border UPI Expansion, Wealth Tech Monetisation & Investor Plays
India's fintech sector is undergoing a seismic transformation powered by artificial intelligence, positioning the nation as a global leader in digital financial innovation by 2025.
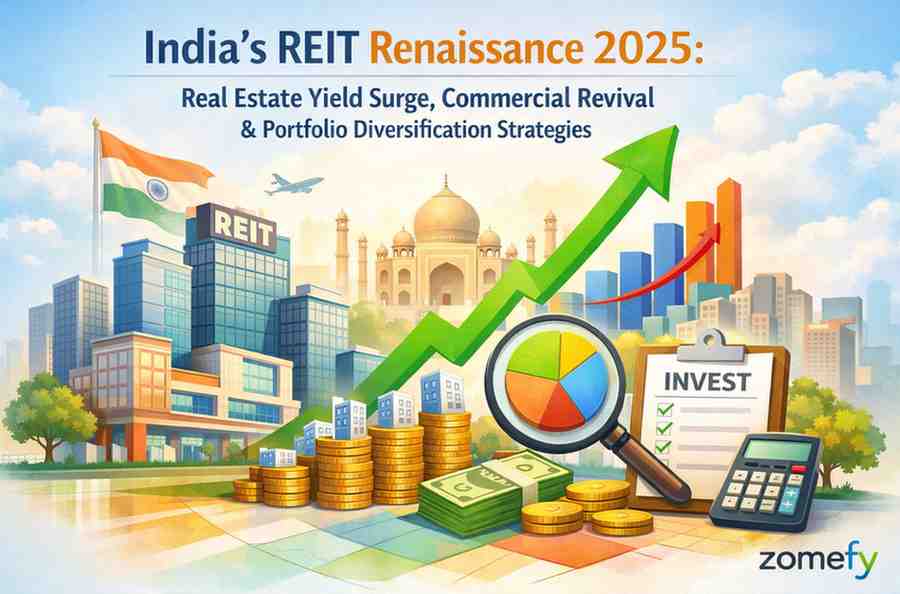
India’s REIT Renaissance 2025: Real Estate Yield Surge, Commercial Revival & Portfolio Diversification Strategies
India's Real Estate Investment Trusts (REITs) are experiencing a remarkable renaissance in 2025, marking a pivotal shift from nascent experimentation to robust market maturity.
Mutual Funds
Comprehensive analysis of mutual funds with performance data and investment strategies
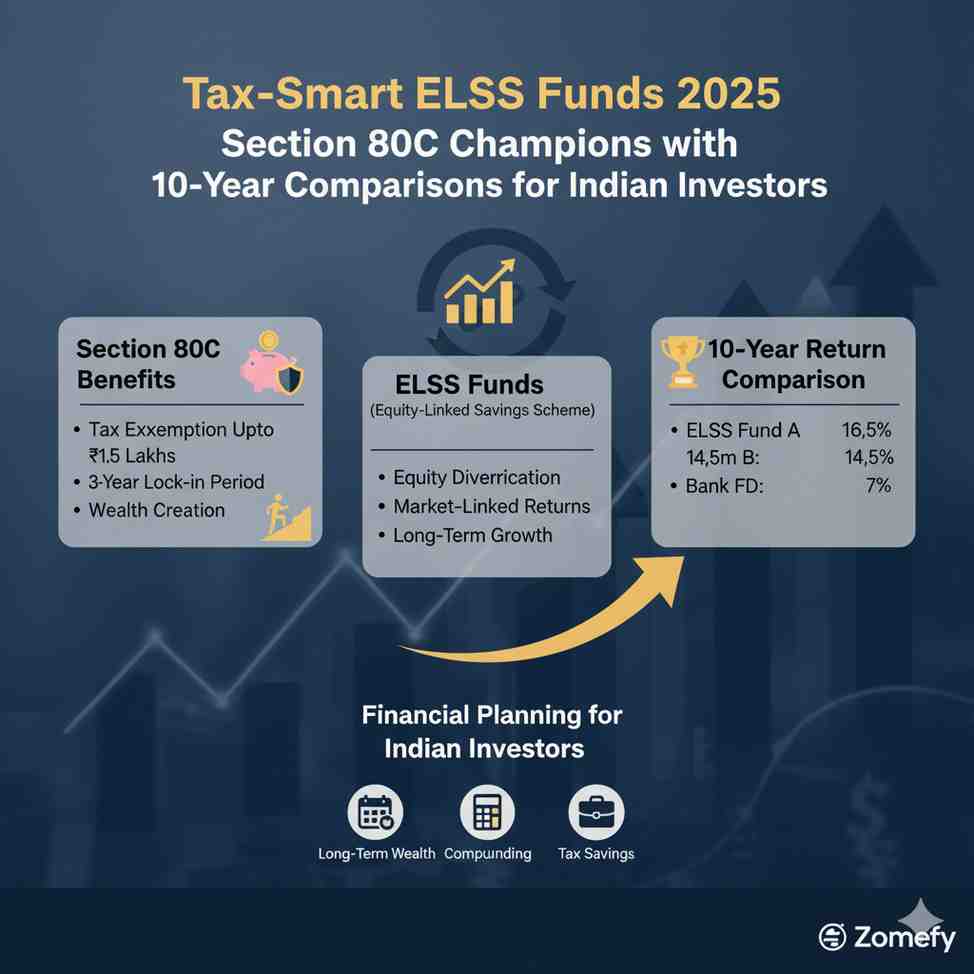
Tax-Smart ELSS Funds 2025: Section 80C Champions with 10-Year Return Comparisons for Indian Investors
Equity-Linked Savings Schemes (ELSS) have long been a cornerstone of tax planning for Indian investors seeking to optimize their tax liability under Section 80C of the Income Tax Act.
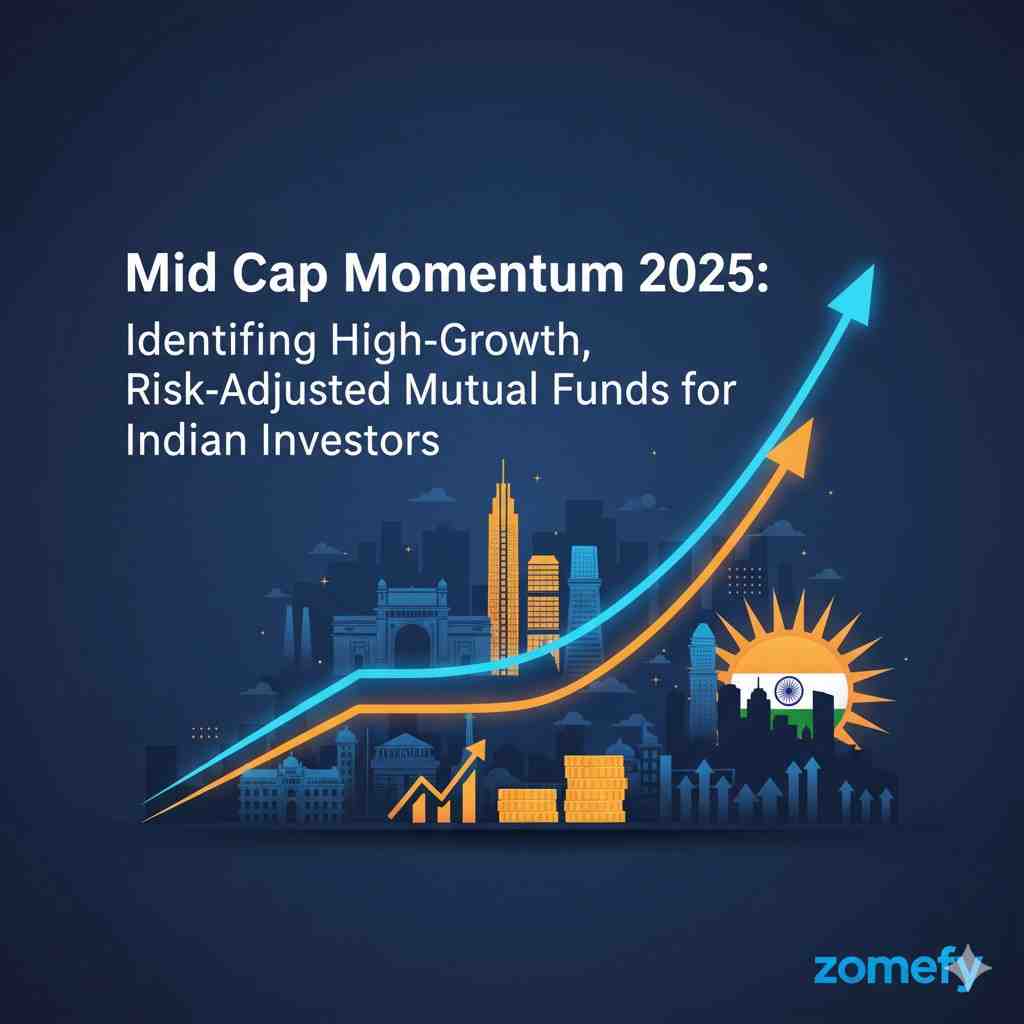
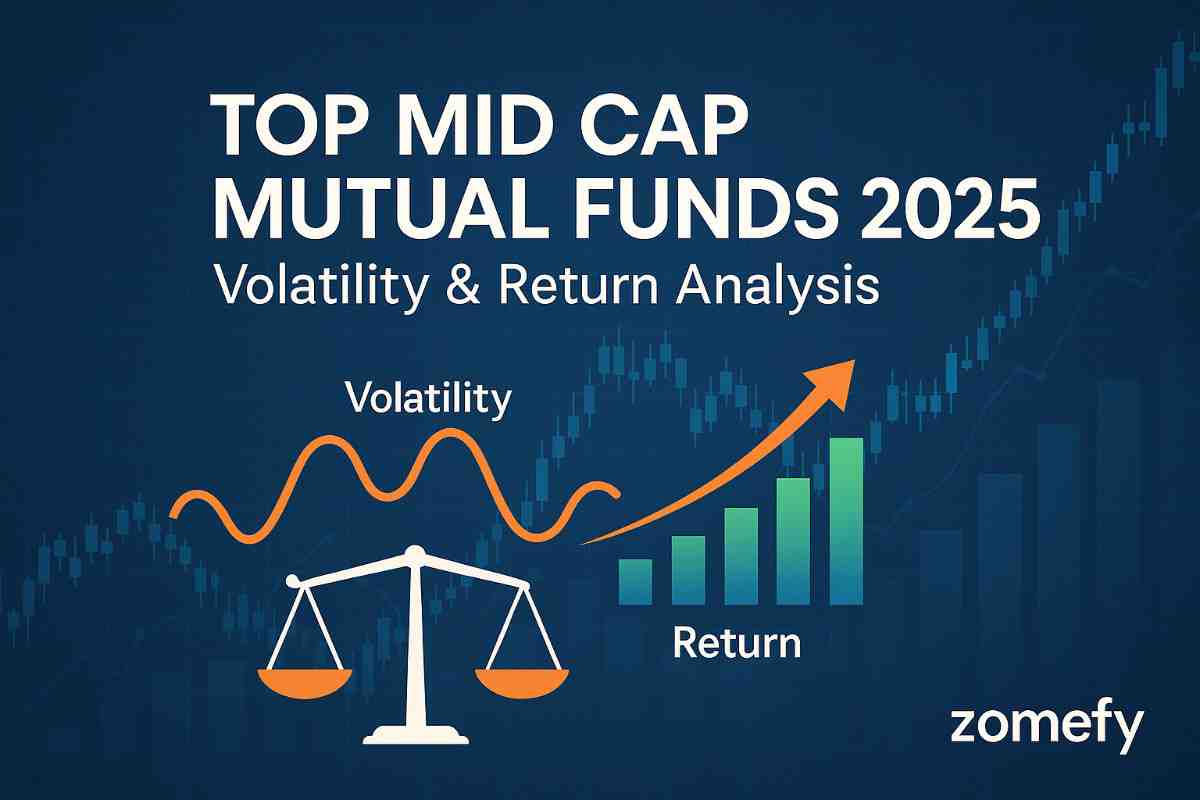
Mid Cap Momentum 2025: Identifying High-Growth, Risk-Adjusted Mutual Funds for Indian Investors
In the evolving landscape of Indian equity markets, mid-cap mutual funds have emerged as a compelling investment avenue for retail investors and financial professionals alike.
Large Cap Leaders 2025: Decoding the 10-Year Consistency of India’s Top Bluechip Funds
Indian retail investors and financial professionals often seek stable and consistent returns from their investments, particularly in the large-cap segment.

Unlocking Investment Potential in 2025: A Beginner's Guide to ETFs and Index Funds in India
As Indian retail investors increasingly seek efficient, cost-effective ways to build wealth, Exchange-Traded Funds (ETFs) and index funds have emerged as powerful tools to unlock investment potenti...
Sector Analysis
Deep-dive analysis of Indian sectors with valuation frameworks and growth prospects
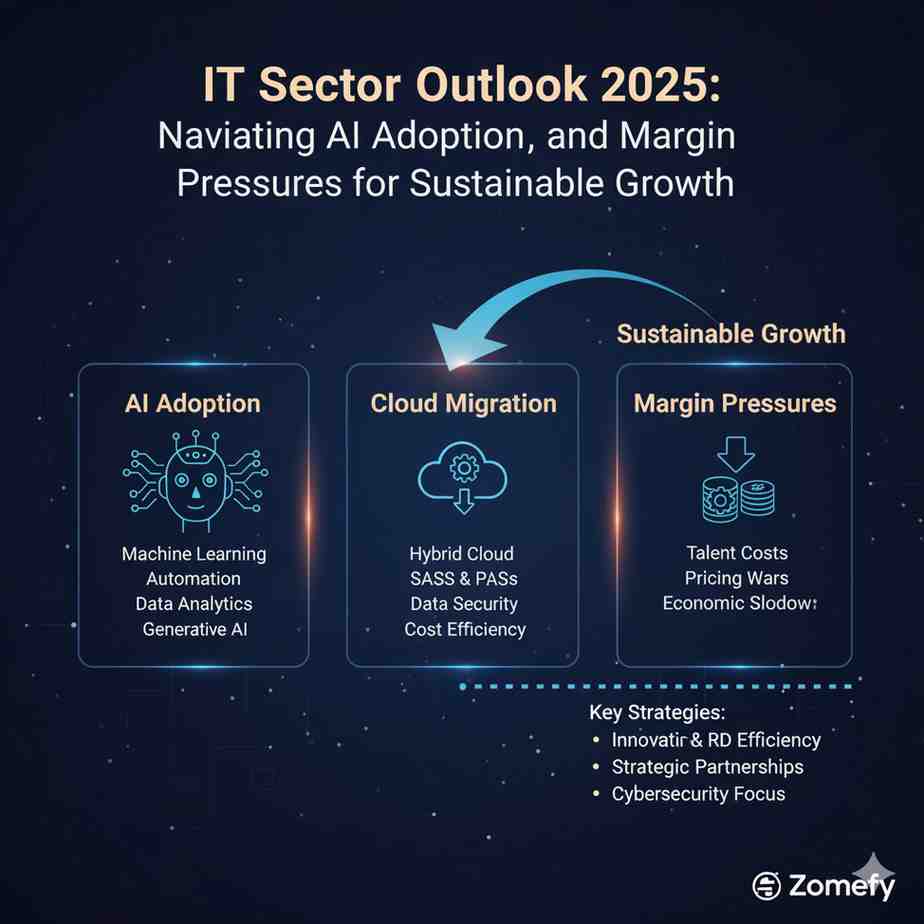
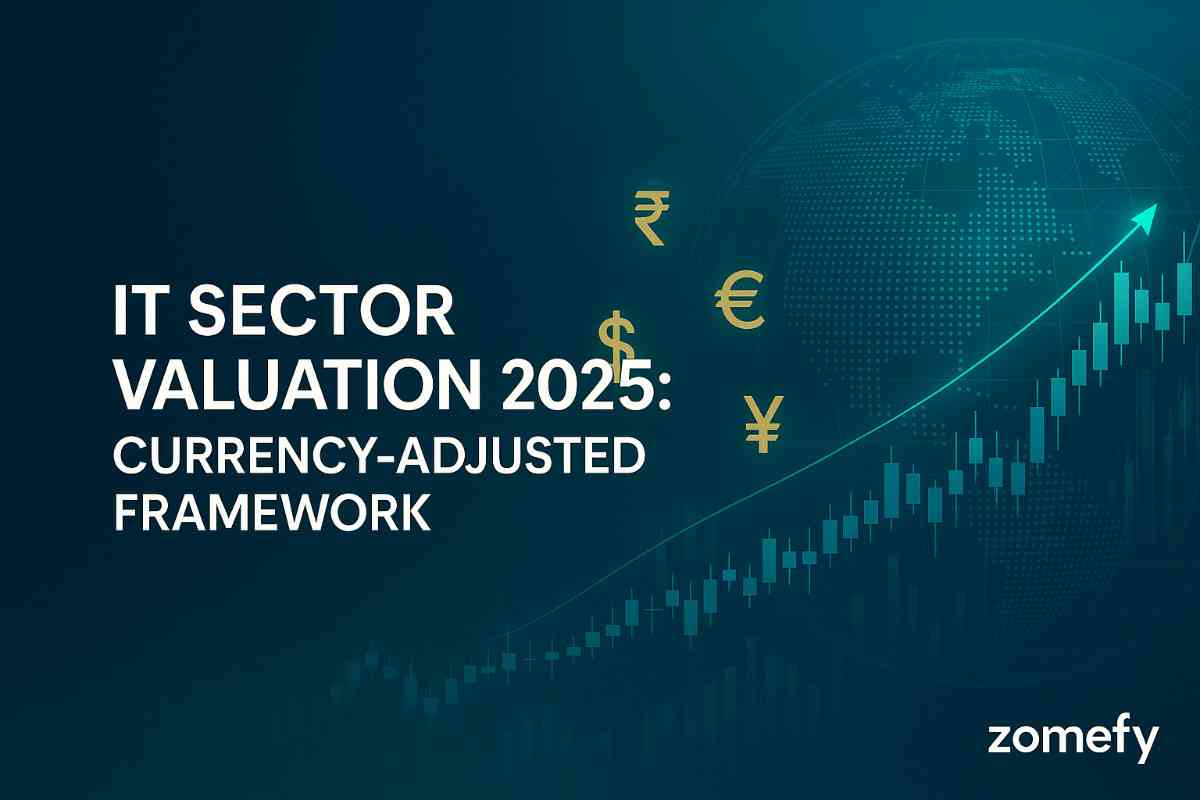
IT Sector Outlook 2025: Navigating AI Adoption, Cloud Migration, and Margin Pressures for Sustainable Growth
India’s IT sector is at a pivotal juncture in 2025, shaped by rapid AI adoption, accelerating cloud migration, and persistent margin pressures.
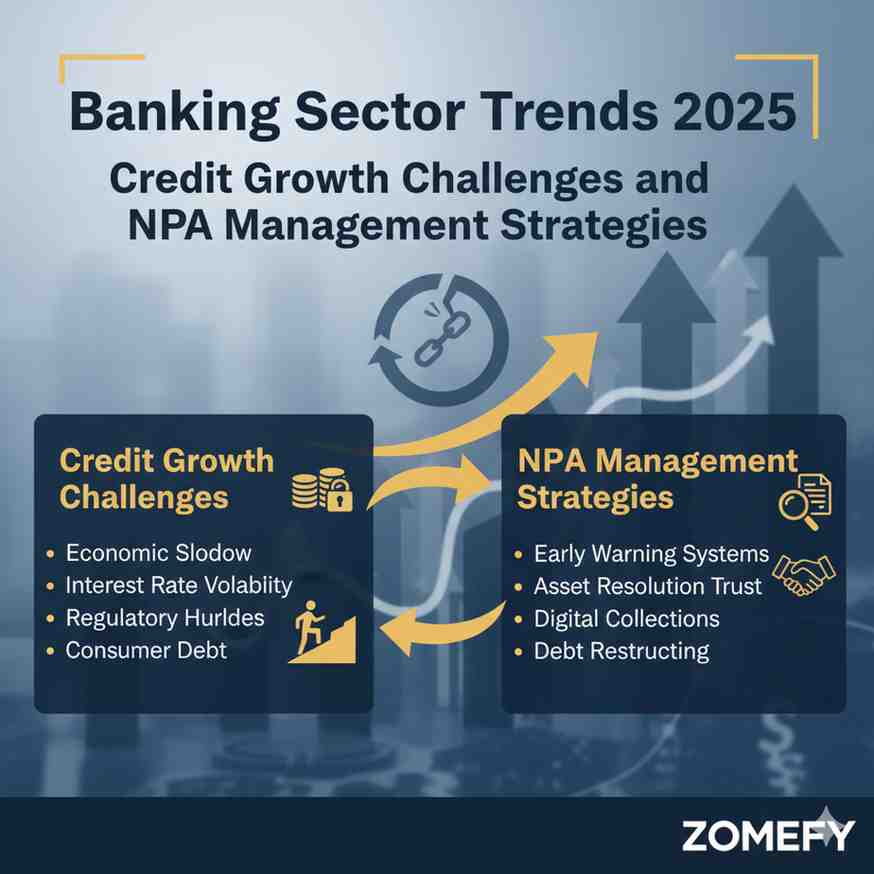
Banking Sector Trends 2025: Credit Growth Challenges and NPA Management Strategies
The Indian banking sector in 2025 stands at a critical juncture characterized by evolving credit growth dynamics, asset quality challenges, and strategic shifts in non-performing asset (NPA) manage...
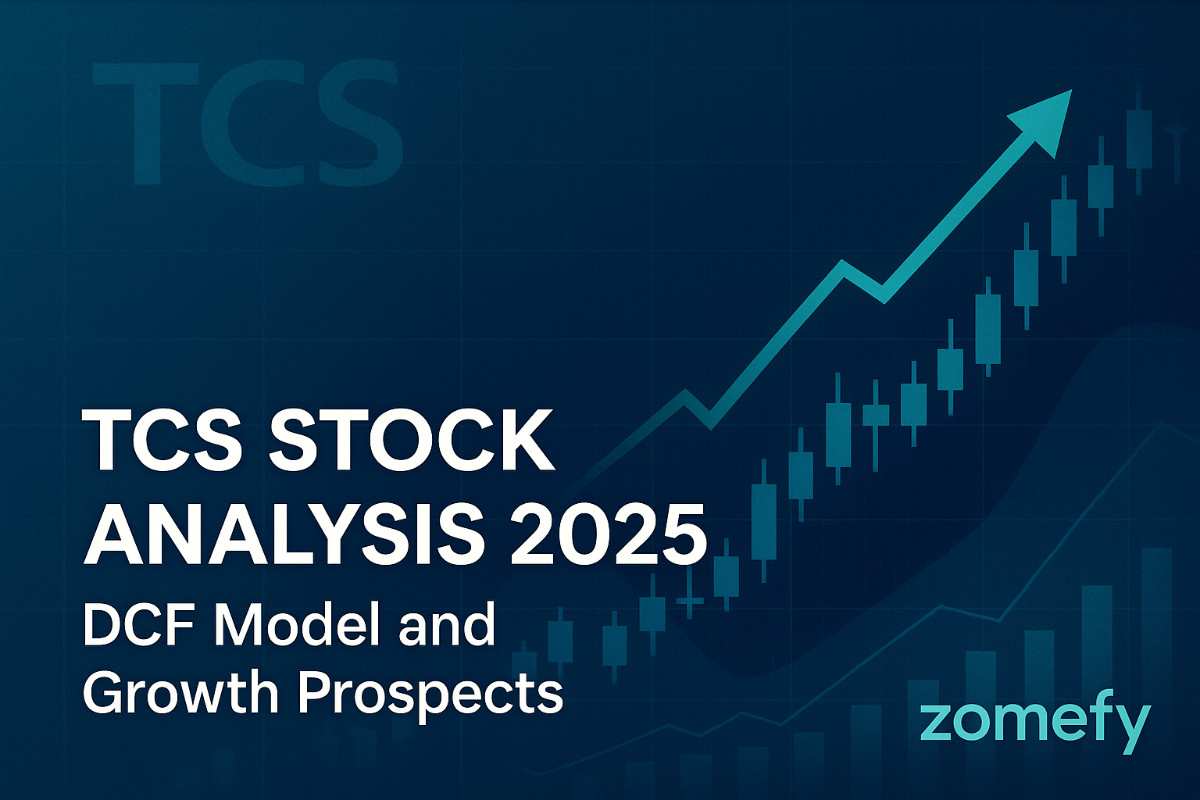
TCS Stock Analysis 2025: DCF Model and Growth Prospects
Complete fundamental analysis of TCS with DCF valuation model, growth prospects, and investment recommendation for 2025.
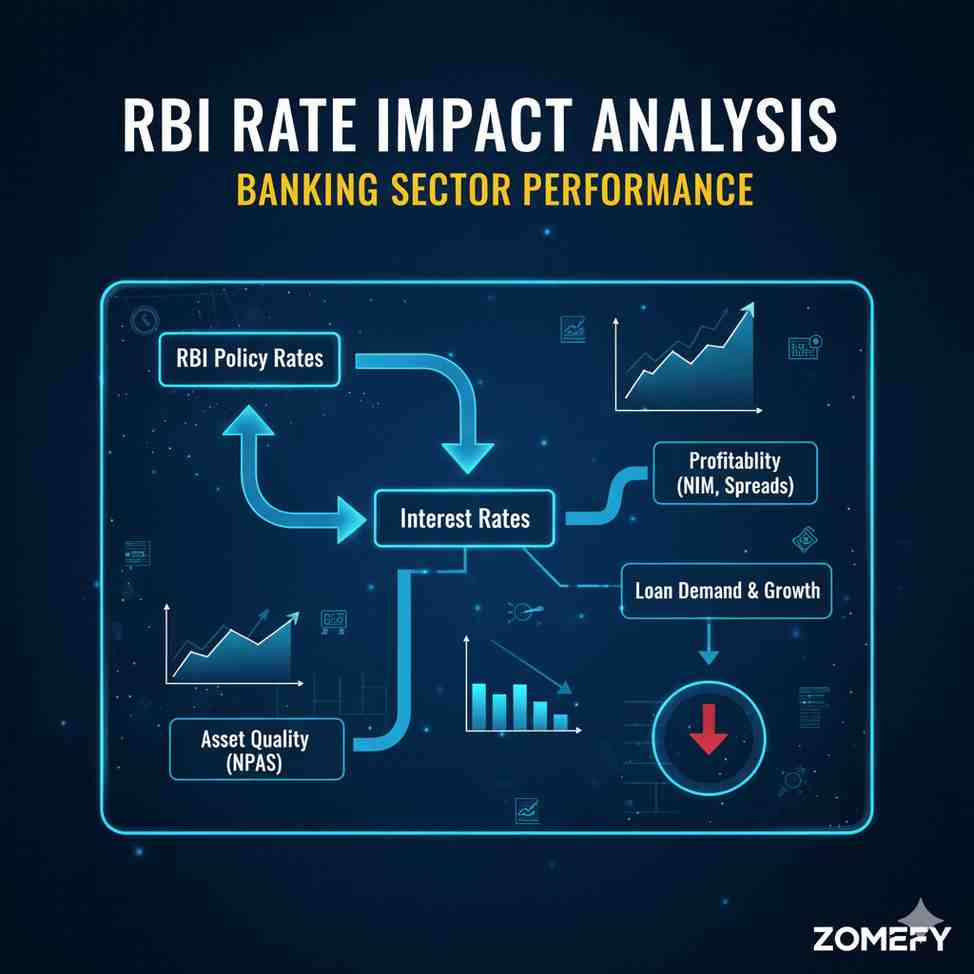
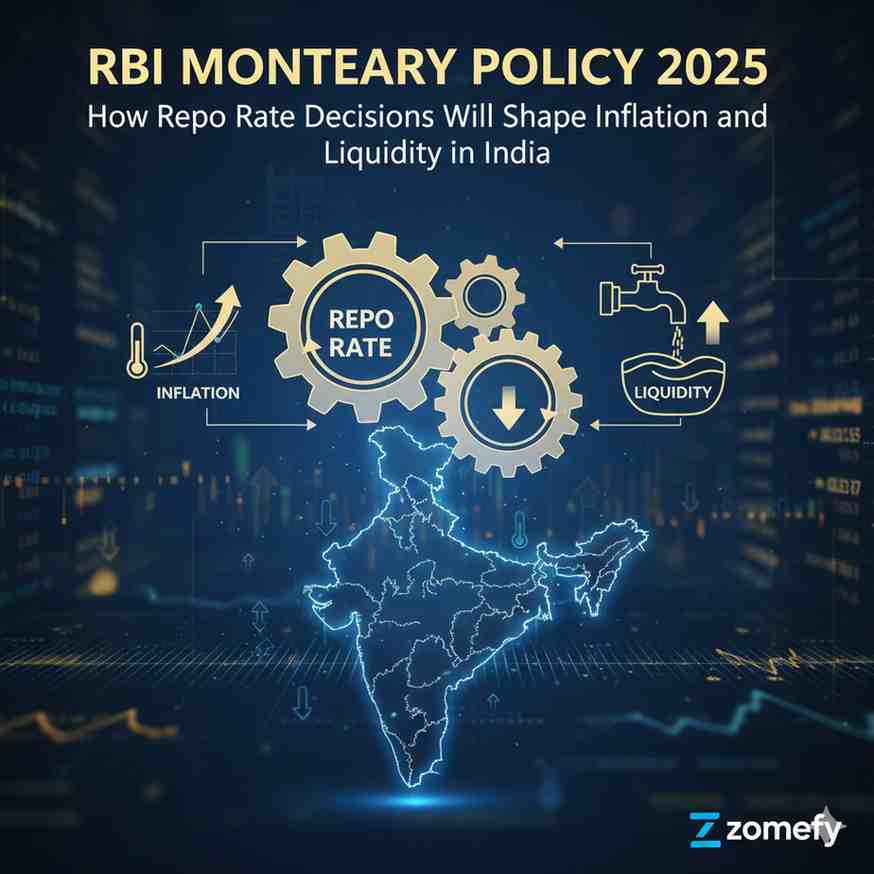
RBI Rate Impact Analysis: Banking Sector Performance
Comprehensive analysis of how RBI rate changes impact banking sector performance with historical data and future outlook.
Technical Analysis
Essential technical indicators and trading strategies for Indian markets
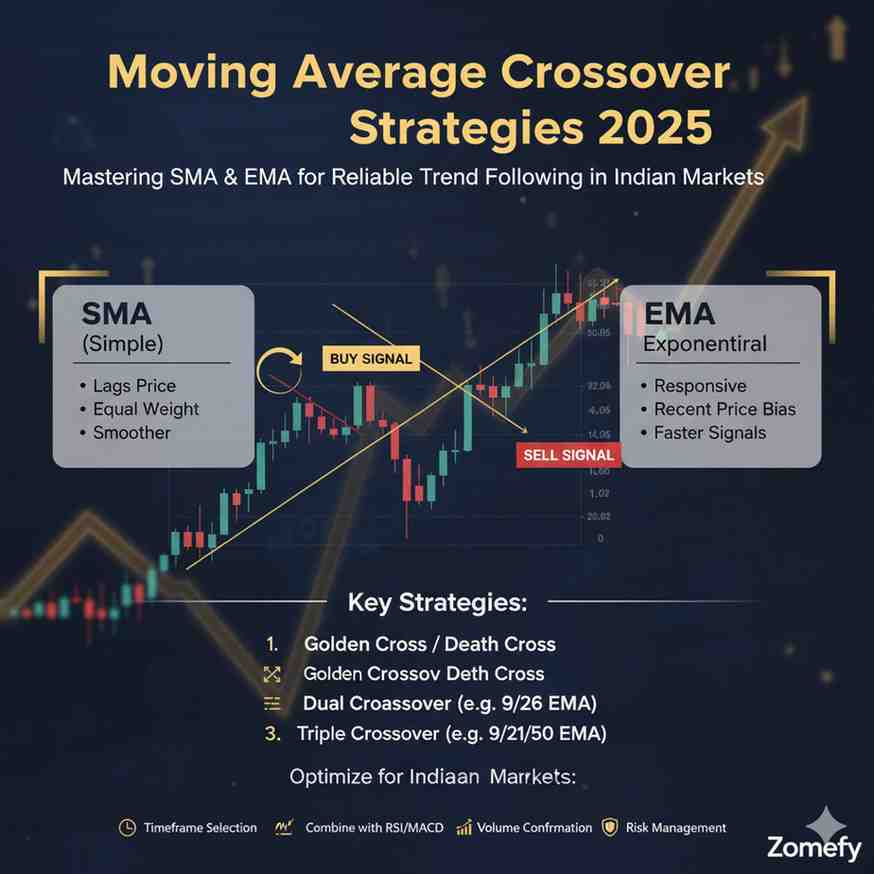
Moving Average Crossover Strategies 2025: Mastering SMA & EMA for Reliable Trend Following in Indian Markets
In the dynamic landscape of Indian financial markets, mastering technical tools for reliable trend identification is crucial for retail investors and financial professionals alike.

Risk Management for Technical Traders: Position Sizing & Stop-Loss Strategies
Master risk management for technical traders with position sizing, stop-loss strategies, and portfolio heat management.

Breakout Trading Strategy: Channel Breaks & Volume Confirmation
Master breakout trading with channel breaks, volume confirmation, and false breakout protection for Indian markets.

Fibonacci Trading Strategy: Retracements & Extensions for Indian Markets
Master Fibonacci trading with retracements, extensions, and confluence analysis for Indian markets.
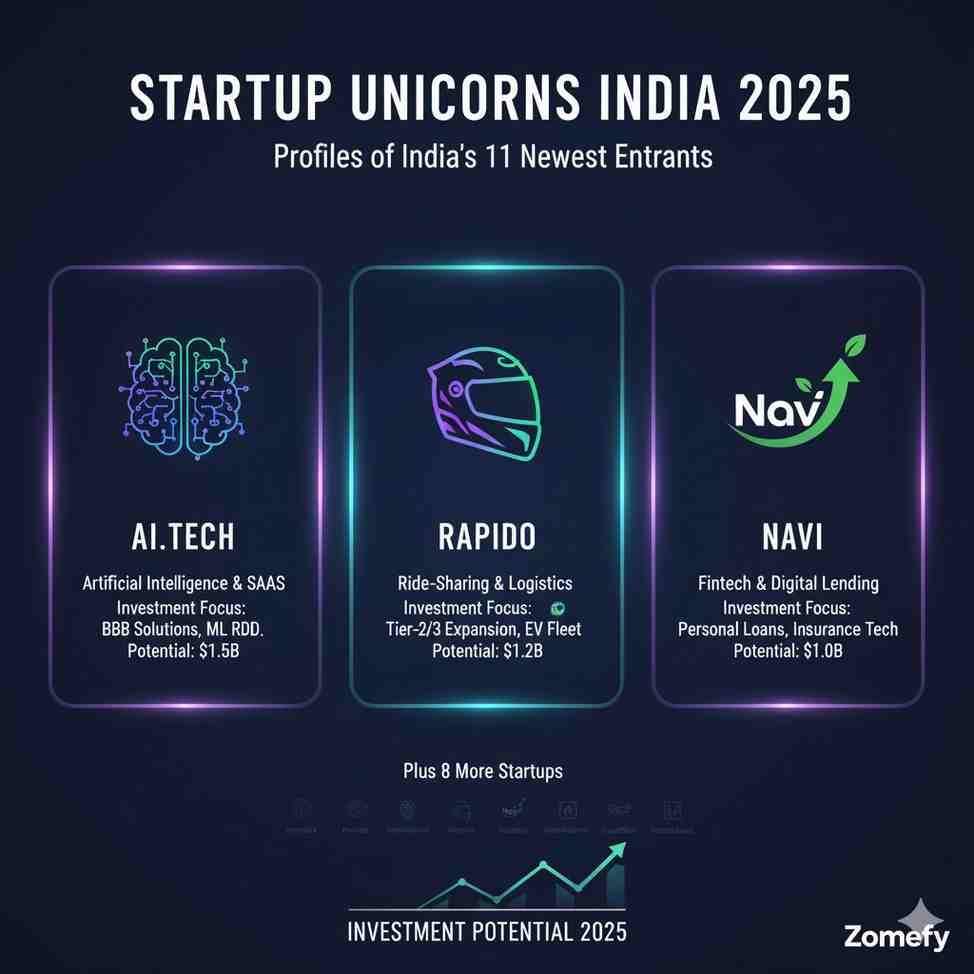
Startup & Unicorn
Deep-dive analysis of Indian startups, unicorns, and new-age tech companies. Understand business models, valuations, unit economics, and investment risks.

BYJU'S 2025: Edtech Unicorn's Restructuring Roadmap and Path to $5B Revival
Imagine a phoenix rising from the ashes of India's edtech boom and bust – that's BYJU'S in 2025, the once-$22 billion unicorn now charting a bold restructuring roadmap toward a $5 billion revival b...

Ola Electric 2025: EV Unicorn's Battery Tech Leap and Path to $10B Profitability
The search results provided contain **contradictory and incomplete information** that makes it impossible to write an accurate article titled "Ola Electric 2025: EV Unicorn's Battery Tech Leap and ...

Paytm 2025: Post-Listing Revival, Revenue Diversification and Path to Sustainable Profits
Imagine a phoenix rising from the ashes of regulatory turmoil – that's Paytm in 2025.

Meesho 2025: Social Commerce Unicorn's $5B IPO Path and Rural Reseller Economics
Imagine a Bengaluru garage in 2015 where two IIT Delhi alumni, Vidit Aatrey and Sanjeev Barnwal, spotted a goldmine in India's overlooked Tier-2 and Tier-3 cities.