50 Years of Indian Stock Market: From Sensex Birth to 2025 - Complete History
Complete 50-year history of Indian stock markets from Sensex birth (1986) to 2025. Decade-by-decade analysis, major crashes, reforms, and lessons with comprehensive data tables.
50 Years of Indian Stock Market: From Sensex Birth to 2025 - Complete History
What You Can Do Next
- Read the full article for complete insights
- Save for later reference
- Share with others learning about this topic
Image not available
On January 1, 1986, the Bombay Stock Exchange (BSE) launched the Sensex with a base value of 100 points. Today, nearly 40 years later, it stands above 80,000 points—a staggering 800x growth. But the story of Indian stock markets begins even earlier, in 1875, when the BSE was founded as Asia's first stock exchange.
This comprehensive guide takes you through 50 years of Indian stock market history (1975-2025), covering the birth of Sensex, landmark reforms, devastating crashes, economic liberalization, the tech boom, global financial crises, and India's emergence as the world's 5th largest stock market.
Whether you're a beginner trying to understand market cycles or an experienced investor seeking historical perspective, this decade-by-decade analysis with comprehensive data tables will give you the complete picture of India's equity journey.
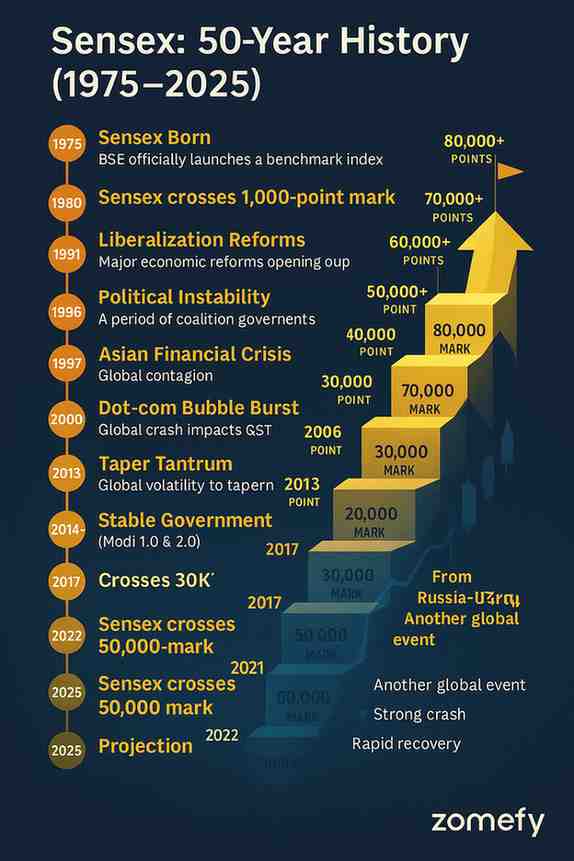
Complete timeline of Sensex journey from 1975 to 2025 showing major milestones, reforms, crashes, and market levels at key turning points
The Foundation Era: 1975-1985 (Pre-Sensex Period)
Before the Sensex was born, Indian stock markets operated without a benchmark index. The BSE, founded in 1875, was already 100 years old, but lacked a systematic way to measure market performance.
Reliance Industries (founded 1973 by Dhirubhai Ambani), Tata Group companies, Birla Group, ITC, Hindustan Unilever (then Hindustan Lever), TELCO (now Tata Motors), and public sector units like SAIL, BHEL.
This decade set the stage for the Sensex's creation. The need for a market benchmark became evident as India slowly moved toward economic reforms. The groundwork laid during 1975-1985 would explode into action in the next decade.
The Birth of Sensex: 1986-1990
Year | Sensex Level (Year-End) | Annual Return (%) | Major Event |
|---|---|---|---|
| 1986 | 286 | +186% | Sensex launch year |
| 1987 | 317 | +10.8% | Black Monday global crash (Oct) |
| 1988 | 495 | +56.2% | Recovery & growth |
| 1989 | 617 | +24.6% | V.P. Singh government |
| 1990 | 1,001 | +62.2% | Sensex crosses 1,000 milestone |
Despite global turmoil (1987 crash), India's market showed resilience due to limited foreign exposure. Domestic factors dominated returns.
The Scam, Crash & Reform Era: 1991-2000
This decade was the most transformative in Indian financial history. It witnessed the biggest scam, worst crash, landmark reforms, and the birth of NSE and SEBI.
Year | Sensex (Year-End) | Annual Return (%) | Major Event |
|---|---|---|---|
| 1991 | 1,908 | +90.5% | Liberalization begins |
| 1992 | 2,281 | +19.5% | Harshad Mehta scam exposed (crashed from 4,467 in Apr) |
| 1993 | 2,443 | +7.1% | Reforms continue, NSE founded |
| 1994 | 3,342 | +36.8% | Economic recovery |
| 1995 | 3,110 | -6.9% | Correction year |
| 1996 | 3,085 | -0.8% | Political instability (3 PMs in 2 years) |
| 1997 | 3,658 | +18.6% | Asian Financial Crisis impact |
| 1998 | 3,055 | -16.5% | Pokhran nuclear tests, sanctions |
| 1999 | 5,006 | +63.9% | Tech boom, Kargil war, BJP stable govt |
| 2000 | 3,972 | -20.6% | Dot-com bubble burst begins |
Despite the scam and crashes, the Sensex grew from 1,908 to 3,972 (2.1x) over the decade—modest but foundational for future growth.
The Tech Boom & Bust: 2000-2005
The new millennium began with euphoria and ended with reality checks. The dot-com bubble burst globally, 9/11 shook markets, and India navigated through tech recession.
Year | Sensex (Year-End) | Annual Return (%) | Major Event |
|---|---|---|---|
| 2000 | 3,972 | -20.6% | Dot-com crash continues |
| 2001 | 3,262 | -17.9% | Ketan Parekh scam, 9/11 attacks |
| 2002 | 3,377 | +3.5% | Recovery begins |
| 2003 | 5,839 | +72.9% | Strong rally, reforms pay off |
| 2004 | 6,603 | +13.1% | BJP loses election shock, then recovery |
| 2005 | 9,398 | +42.3% | India Shining momentum |
Sector | Performance | Key Drivers |
|---|---|---|
| IT Services | 🚀 **Outperformer** (300%+) | Y2K aftermath, outsourcing boom |
| Banking | ⬆️ Strong (150%+) | NPA cleanup, retail credit boom |
| Telecom | 🚀 **Explosive** (400%+) | Mobile penetration, deregulation |
| Pharma | ⬆️ Moderate (80%+) | Generic exports, US market access |
| Real Estate | 🚀 **Strong** (200%+) | Urbanization, easy credit |
| Auto | ⬆️ Steady (120%+) | Rising middle class |
After crashes, markets can deliver outsized returns (2003: +73%). Patience and staying invested through downturns pays off.
The Bull Run & Crash: 2006-2010
This was India's first taste of a true global bull market—and subsequent global financial crisis.
Year | Sensex (Year-End) | Annual Return (%) | Major Event |
|---|---|---|---|
| 2006 | 13,787 | +46.7% | India growth story peaks |
| 2007 | 20,287 | +47.2% | Bull run continues, Jan 2008 peak: 21,206 |
| 2008 | 9,647 | -52.5% | Lehman collapse, worst crash |
| 2009 | 17,464 | +81.0% | Stimulus-driven recovery |
| 2010 | 20,509 | +17.4% | Return to pre-crisis levels |
Month (2008) | Sensex Level | Monthly Change (%) |
|---|---|---|
| Jan | 21,206 | Peak |
| Mar | 15,644 | -26% |
| May | 17,287 | +10% (false recovery) |
| Sep | 12,860 | -26% (Lehman on Sep 15) |
| Oct | 9,789 | -24% (worst month ever) |
| Dec | 9,647 | -1% (stabilization) |
1. Strong domestic consumption (not export-dependent like China) 2. Banking sector not exposed to toxic assets 3. RBI's swift action (rate cuts, liquidity injection) 4. Fiscal stimulus by government 5. China+India led emerging market recovery
Markets can fall 50%+ in months. Diversification (gold, debt) helps. But those who stayed invested recovered fully by 2010 and profited handsomely in the next decade.
The Slow Growth & Taper Tantrum Era: 2011-2015
Post-2008 recovery gave way to policy paralysis, corruption scandals, and the "Taper Tantrum" of 2013.
Year | Sensex (Year-End) | Annual Return (%) | Major Event |
|---|---|---|---|
| 2011 | 15,455 | -24.6% | Inflation, scams, weak growth |
| 2012 | 19,427 | +25.7% | Hope of reforms |
| 2013 | 21,170 | +9.0% | Taper Tantrum mid-year crash, recovery |
| 2014 | 27,499 | +29.9% | Modi election landslide (May 2014) |
| 2015 | 26,118 | -5.0% | Global slowdown, China crash fears |
1. Jan Dhan Yojana (financial inclusion) 2. Make in India campaign 3. Ease of Doing Business push 4. Digital India initiative 5. Swachh Bharat Mission 6. Coal, spectrum auctions (ending UPA-era arbitrary allocation)
Sector | Performance | Why? |
|---|---|---|
| IT Services | ⬆️ Moderate (40%) | Rupee depreciation helped exports |
| Pharma | 🚀 **Outperformer** (120%) | US generic opportunity, rupee tailwind |
| FMCG | ⬆️ Steady (60%) | Defensive play during uncertainty |
| PSU Banks | ⬇️ **Underperformer** (-20%) | Rising NPAs, bad loans surfacing |
| Infrastructure | ⬇️ Weak (0%) | Policy paralysis, stalled projects |
Political stability and reform expectations can trigger sharp rallies (2014). But without execution, gains fade (2015 correction).
Reforms, Disruption & Demonetization: 2016-2020
This period saw bold reforms (GST, IBC, Real Estate RERA), massive disruptions (Demonetization, Jio), and ended with a pandemic.
Year | Sensex (Year-End) | Annual Return (%) | Major Event |
|---|---|---|---|
| 2016 | 26,626 | +1.9% | Demonetization (Nov 8) |
| 2017 | 34,057 | +27.9% | GST launch, Jio disruption |
| 2018 | 36,068 | +5.9% | IL&FS crisis, trade war fears |
| 2019 | 41,254 | +14.4% | Modi 2.0, corporate tax cuts |
| 2020 | 47,751 | +15.8% | COVID crash & recovery |
Date | Sensex Level | Event |
|---|---|---|
| Jan 20, 2020 | 42,273 | All-time high |
| Mar 23, 2020 | 25,981 | Crash bottom (-38%) |
| May 2020 | 32,000 | Lockdown extends, slow recovery |
| Aug 2020 | 38,000 | V-shaped recovery |
| Nov 2020 | 44,000 | Vaccine news (Pfizer) |
| Dec 31, 2020 | 47,751 | Year-end (+83% from low) |
Panics create opportunities. Those who bought during March 2020 crash saw 80%+ returns by year-end. Staying invested through volatility is key.
The Bull Run Continues: 2021-2025
Post-COVID, markets entered a liquidity-driven bull run, then faced inflation, rate hikes, and geopolitical tensions.
Year | Sensex (Year-End) | Annual Return (%) | Major Event |
|---|---|---|---|
| 2021 | 58,254 | +22.0% | Liquidity rally, IPO boom |
| 2022 | 61,168 | +5.0% | Rate hikes, Russia-Ukraine war |
| 2023 | 72,240 | +18.1% | India 5th largest economy |
| 2024 | 81,500 | +12.8% | Modi 3.0, 80,000 milestone |
| 2025 (Oct) | 83,184 | +2.1% YTD | Range-bound, valuation concerns |
Trend | Impact |
|---|---|
| **Retail Investor Boom** | Demat accounts grew from 4 crore (2020) to 16 crore (2025) |
| **SIP Revolution** | Monthly SIP inflows: ₹20,000+ crore (2025) vs ₹8,000 crore (2020) |
| **IPO Frenzy** | 500+ IPOs raised ₹5 lakh crore (2021-2025) |
| **India vs China** | India gained global investor preference as China slowed |
| **Financialization** | Household savings shifted from gold/real estate to equities |
| **Technology Adoption** | UPI, mobile trading apps democratized investing |
Liquidity drives markets short-term, but fundamentals matter long-term. 2021's euphoria gave way to 2022's reality, but patient investors still earned double-digit CAGR.
50-Year Performance Summary: 1975-2025
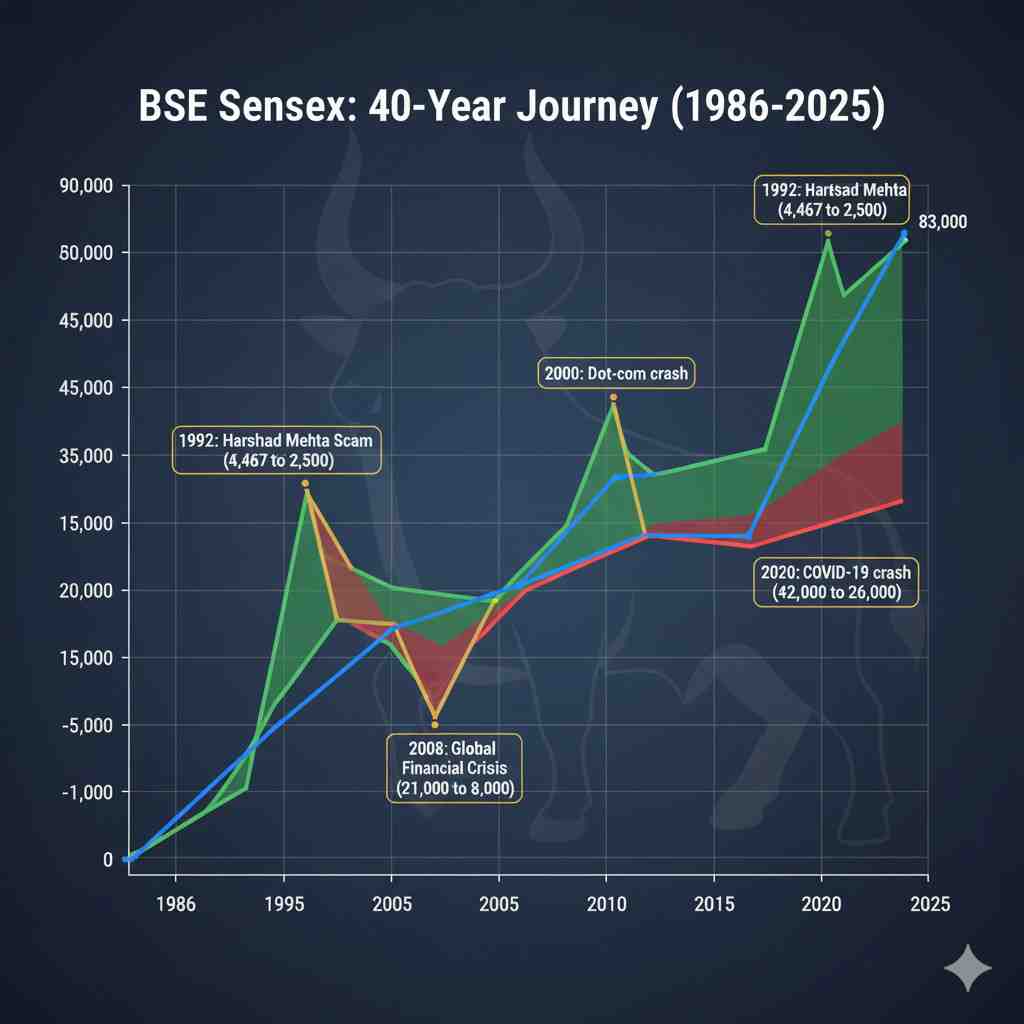
Figure 1: BSE Sensex historical price chart showing major market events, crashes, and bull runs from 1986 to 2025
Decade | Starting Sensex | Ending Sensex | CAGR (%) | Highlights |
|---|---|---|---|---|
| 1986-1990 | 100 | 1,001 | 58.4% | Sensex birth, crosses 1,000 |
| 1991-2000 | 1,908 | 3,972 | 7.6% | Liberalization, scams, reforms |
| 2001-2010 | 3,972 | 20,509 | 18.0% | Tech boom/bust, 2008 crisis |
| 2011-2020 | 15,455 | 47,751 | 11.9% | Slow growth, Modi era, COVID |
| 2021-2025 | 58,254 | 83,184 | 11.8% | Liquidity boom, rate hikes |
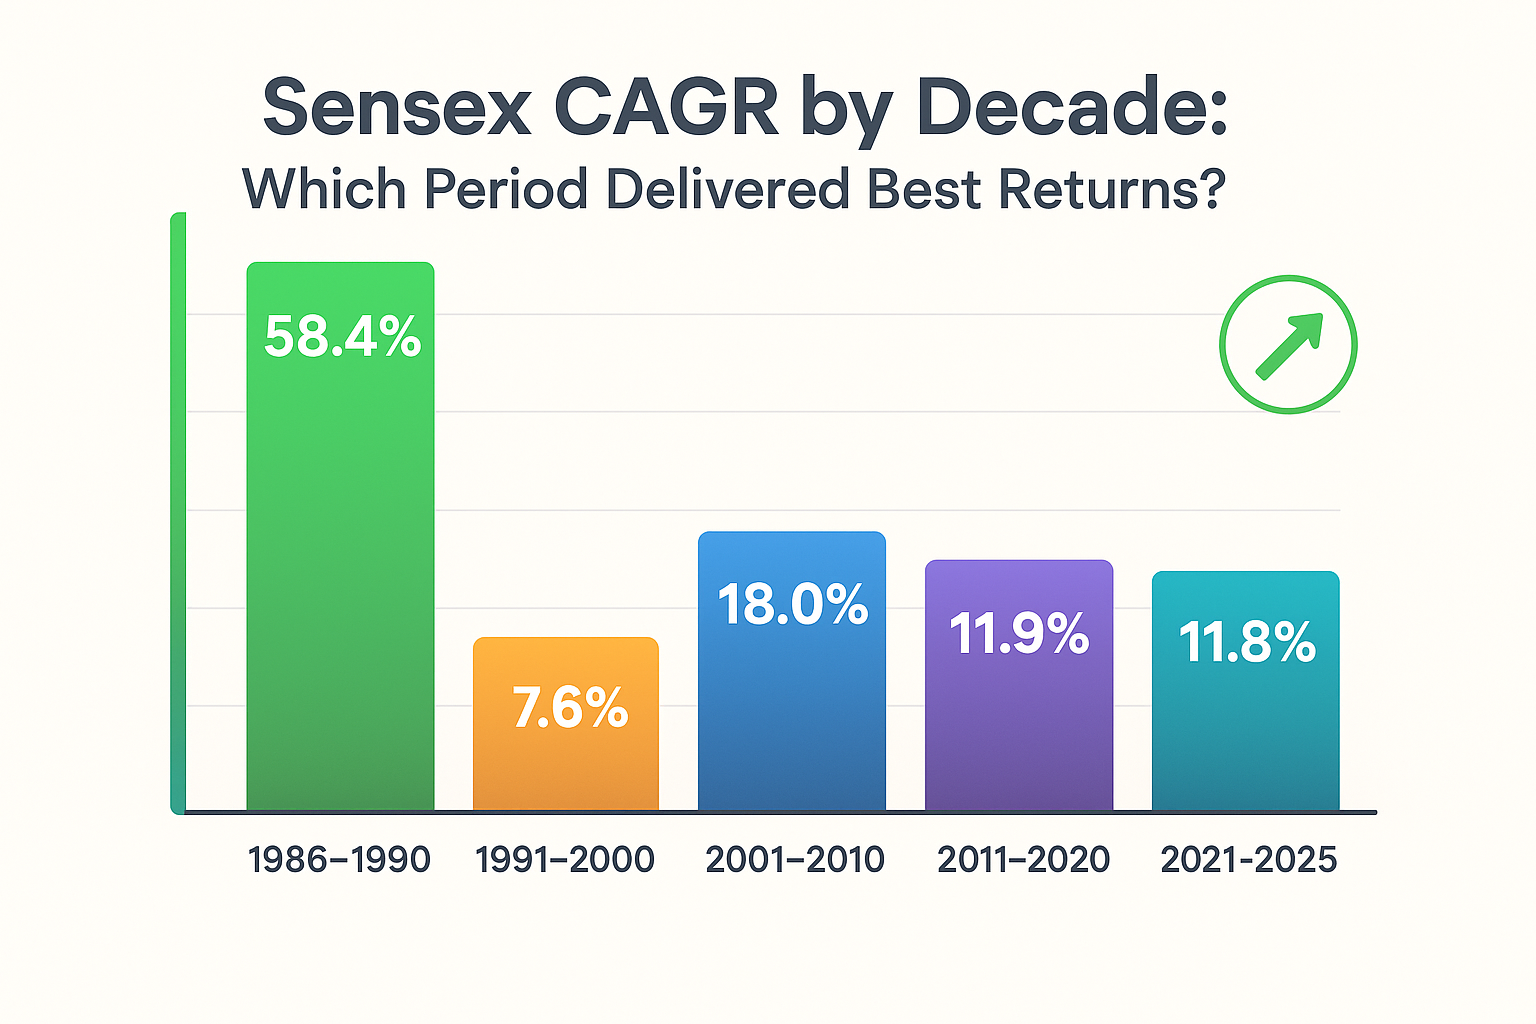
Figure 2: Decade-wise CAGR comparison showing which periods delivered the best returns (1986-2025)
Investment Year | Amount Invested | Value in 2025 | CAGR (%) |
|---|---|---|---|
| 1986 | ₹1,00,000 | ₹8.30 crore | 18.2% |
| 1991 | ₹1,00,000 | ₹43.6 lakh | 19.4% |
| 2000 | ₹1,00,000 | ₹20.9 lakh | 12.8% |
| 2010 | ₹1,00,000 | ₹4.05 lakh | 10.0% |
| 2020 | ₹1,00,000 | ₹1.74 lakh | 11.8% |
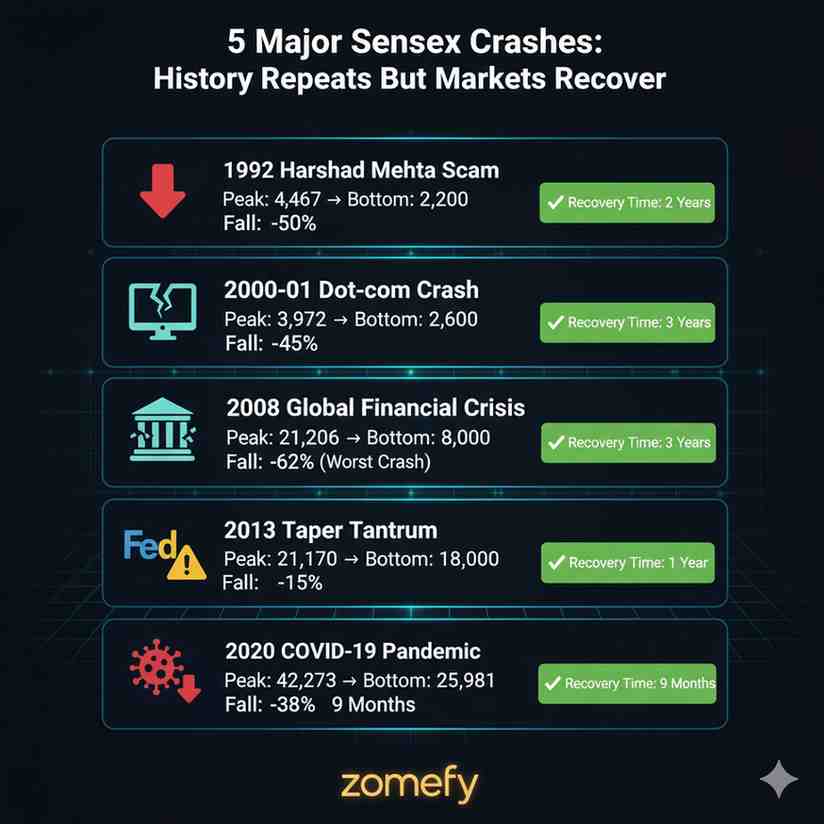
Figure 3: Timeline of 5 major market crashes showing peak-to-bottom falls and recovery times
Milestone | Date | Time Taken |
|---|---|---|
| Sensex 100 | Jan 1, 1986 | Base |
| Sensex 1,000 | July 25, 1990 | 4.5 years |
| Sensex 10,000 | Feb 7, 2006 | 20 years |
| Sensex 20,000 | Dec 11, 2007 | 1.8 years |
| Sensex 30,000 | Apr 27, 2017 | 9.3 years |
| Sensex 40,000 | May 23, 2019 | 2 years |
| Sensex 50,000 | Jan 21, 2021 | 1.7 years |
| Sensex 60,000 | Sep 24, 2021 | 8 months |
| Sensex 70,000 | Dec 11, 2023 | 2.2 years |
| Sensex 80,000 | Jul 3, 2024 | 7 months |
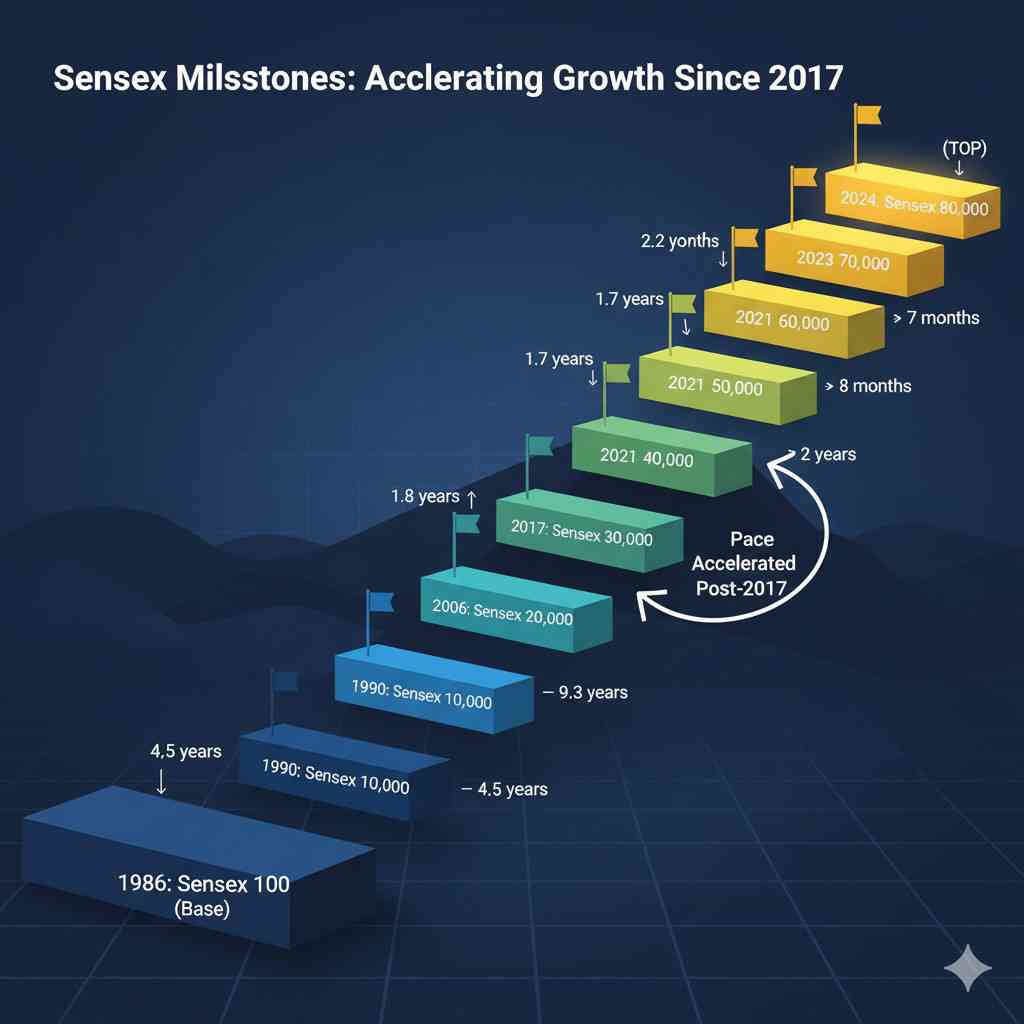
Figure 4: Staircase visualization of Sensex milestones showing accelerating growth since 2017
Lessons from 50 Years of Indian Stock Markets
The journey from 1975 to 2025 offers invaluable lessons for every investor—from beginners to seasoned professionals. Here are the 10 most important takeaways that can transform your investment approach:
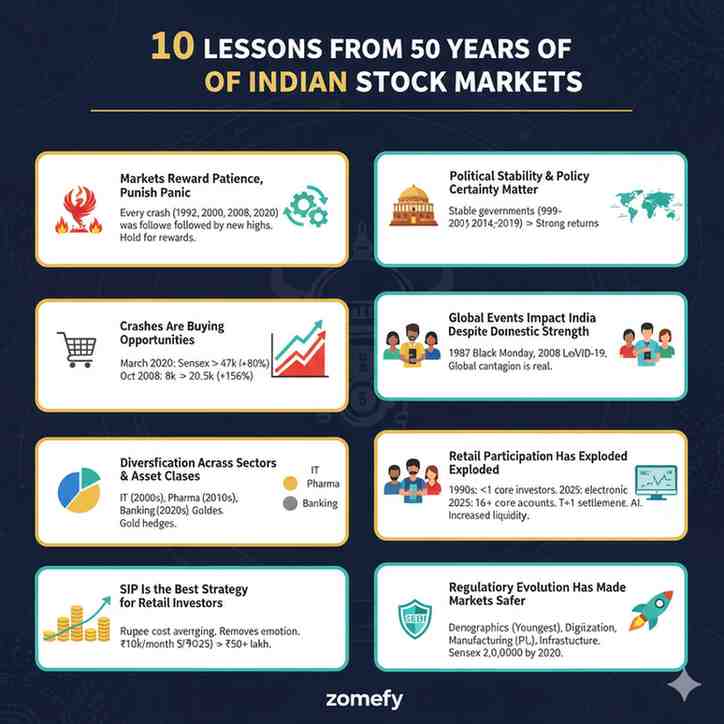
Figure 5: Visual summary of 10 key investment lessons learned from 50 years of Indian stock market history
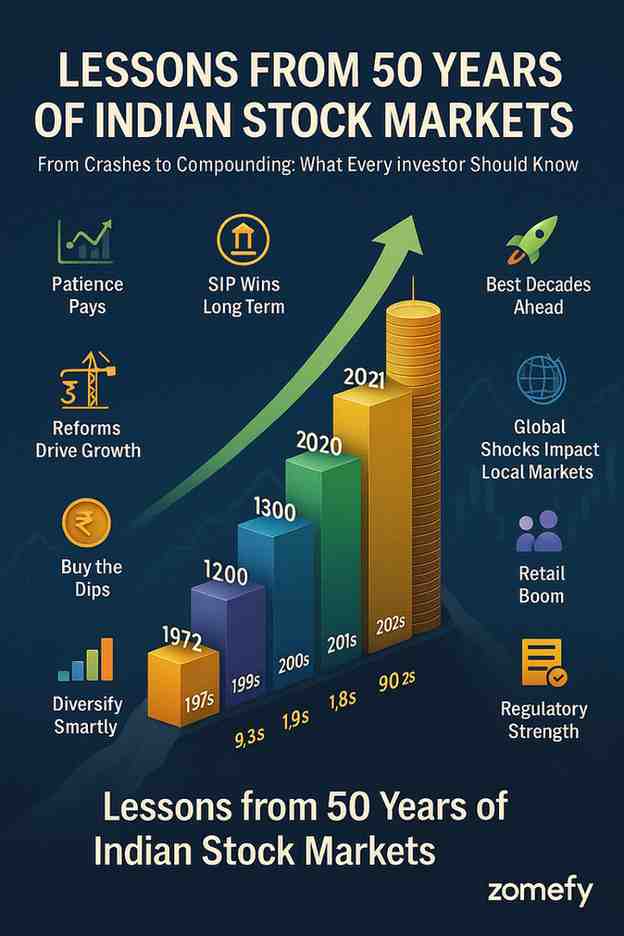
Figure 6: Detailed breakdown of critical lessons including patience, political stability, crash opportunities, and diversification strategies
How to Invest Based on Historical Lessons
Conclusion
The 50-year journey of Indian stock markets is a story of resilience, reform, and remarkable growth. From a manual, scam-prone, closed economy in the 1980s to a digitized, regulated, globally integrated market in 2025, the transformation is extraordinary.
If India maintains 6-8% GDP growth, improves ease of doing business, leverages its demographic dividend, and benefits from China+1 manufacturing shift, the Sensex could realistically hit 1,50,000-2,00,000 by 2030 (12-15% CAGR from current 83,000).
1. Start investing NOW (best time was 1986, second best is today) 2. Use SIP for disciplined investing 3. Stay invested through volatility (15-20 year horizon minimum) 4. Diversify across large, mid, small caps 5. Rebalance annually 6. Keep learning from market history (those who ignore it, repeat mistakes)
The Indian stock market has compounded wealth at 18% annually for 40 years despite scams, crashes, wars, pandemics, and political turmoil. Imagine what patient investors over the next 40 years will achieve as India becomes a $10 trillion economy.
Frequently Asked Questions
What was the Sensex value when it started in 1986?
The BSE Sensex was launched on January 1, 1986, with a base value of 100 points. It represented 30 stocks across major sectors of the Indian economy. By the end of 1986, it had already surged to 286 points, delivering 186% returns in its first year.
What is the highest ever Sensex level?
As of October 2025, the Sensex all-time high is approximately 85,000+ points, reached in September 2024. The index has grown 850x from its 1986 base of 100 points, delivering an 18%+ CAGR over nearly 40 years.
How many times has Sensex crashed in history?
Sensex has experienced 5 major crashes: 1) 1992 Harshad Mehta Scam (-50%), 2) 2000-01 Dot-com Bust + Ketan Parekh Scam (-45%), 3) 2008 Global Financial Crisis (-60%), 4) 2011 Euro Crisis + Taper Tantrum (-25%), and 5) 2020 COVID-19 Pandemic (-38%). Each crash was followed by recovery to new highs within 2-3 years.
What caused the 1992 Harshad Mehta scam?
Harshad Mehta exploited loopholes in the banking system's Ready Forward (RF) deals to divert ₹4,000+ crore into stocks, artificially inflating prices. He used fake Bank Receipts (BRs) to secure funds without actual collateral. When exposed in April-May 1992, the Sensex crashed from 4,467 to below 2,500, wiping out 50% of market value.
How did Sensex perform during COVID-19 pandemic?
COVID-19 caused the fastest crash in Sensex history. From an all-time high of 42,273 on January 20, 2020, it plunged to 25,981 on March 23, 2020 (-38% in 2 months). However, massive fiscal and monetary stimulus led to a V-shaped recovery. By December 2020, Sensex closed at 47,751, up 83% from the March low.
What was the impact of 2008 Global Financial Crisis on India?
The 2008 crisis hit Indian markets hard. Sensex fell from 21,206 (January 2008) to 8,000 (March 2009), a brutal 62% crash. Foreign Institutional Investors (FIIs) pulled out ₹50,000+ crore. However, India's strong domestic economy, banking sector health, and swift RBI/government action helped recovery. By 2010, Sensex crossed 20,000 again.
Which decade gave the best Sensex returns?
The 1986-1990 period delivered the highest CAGR at 58.4%, but from a low base. For sustained growth, the 2001-2010 decade delivered 18% CAGR despite dot-com crash and 2008 crisis. The 1991-2000 decade, despite liberalization, delivered only 7.6% CAGR due to scams and Asian Crisis volatility.
How much would ₹1 lakh invested in 1986 be worth today?
₹1 lakh invested in Sensex in 1986 would be worth approximately ₹8.3 crore in 2025 (assuming reinvestment of dividends). This represents an 18.2% CAGR over 39 years, beating inflation (6-7%), gold (10-11%), and real estate (8-10%) by a wide margin.
What major reforms shaped Indian stock markets?
Key reforms: 1) 1991 Economic Liberalization (opened markets to FIIs), 2) 1992 SEBI Act (regulatory oversight), 3) 1993-94 Electronic trading (NSE launch), 4) 2000 NSDL/CDSL (depositories), 5) 2017 GST (tax simplification), 6) 2016 IBC (bankruptcy code), and 7) 2020 T+1 settlement (faster trade clearing).
Should I invest in Sensex now or wait for a crash?
Timing the market is nearly impossible. Historical data shows that time in the market beats timing the market. A better approach is Systematic Investment Plan (SIP) which averages out volatility. If Sensex PE is >25 (expensive), increase SIP allocation to mid/small caps or debt. If PE <15 (cheap), increase equity allocation. For 10+ year investors, starting now beats waiting.
References
- [1] BSE Sensex Historical Data - Bombay Stock Exchange Official Website. View Source ↗(Accessed: 2025-10-03)
- [2] NSE India Historical Performance - National Stock Exchange of India. View Source ↗(Accessed: 2025-10-03)
- [3] SEBI Annual Reports (1992-2025) - Securities and Exchange Board of India. View Source ↗(Accessed: 2025-10-03)
- [4] Economic Liberalization and Indian Capital Markets - Reserve Bank of India Publications. View Source ↗(Accessed: 2025-10-03)
- [5] Harshad Mehta Scam: Timeline and Impact - Economic Times Archives. View Source ↗(Accessed: 2025-10-03)
- [6] 2008 Global Financial Crisis: India Impact Study - NBER Working Papers. View Source ↗(Accessed: 2025-10-03)
Continue Your Investment Journey
Discover more insights that match your interests
India’s 2025 Economic Outlook: How GDP Growth, Employment Trends, and Inflation Dynamics Shape Retail Investment Strategies
India's economic trajectory heading into 2025 presents a compelling landscape for retail investors and financial professionals alike.

Bajel Projects Stock Analysis 2025: Recent IPO Listing Surge & Order Wins Ignite Multibagger Potential
Bajel Projects Limited (NSE: BAJEL), a prominent player in India's power transmission and infrastructure EPC sector, has emerged as a standout performer following its recent IPO listing and a landm...

Adani Ports Stock Analysis 2025: Record Cargo Volumes & Global Terminal Wins Fuel Multibagger Momentum
Adani Ports and Special Economic Zone Limited (APSEZ), India's largest private port operator, is riding high on record cargo volumes and strategic global terminal wins, positioning the stock for mu...

Indigo Paints Stock Analysis 2025: Sudden Promoter Buyback & Block Deal Sparks Mid‑Cap Rally
Indigo Paints Ltd (NSE: INDIGOPNTS), a leading player in India's decorative paints sector, has sparked a mid-cap rally following a sudden promoter buyback announcement and a high-profile block deal...
Explore More Insights
Continue your financial education journey
