L&T Finance: Can Retail Lending Expansion Sustain Margins Amid Rising Credit Costs and Regulatory Scrutiny?
L&T Finance Holdings (LTFH), a leading non-banking financial company (NBFC) listed on NSE and BSE, matters today as it executes a high-stakes pivot from.
L&T Finance: Can Retail Lending Expansion Sustain Margins Amid Rising Credit Costs and Regulatory Scrutiny?
What You Can Do Next
- Read the full article for complete insights
- Save for later reference
- Share with others learning about this topic
Image not available
L&T Finance Holdings (LTFH), a leading non-banking financial company (NBFC) listed on NSE and BSE, matters today as it executes a high-stakes pivot from wholesale to retail lending amid India's competitive financial services landscape. This analysis, triggered by the company's recent Q3 FY26 business update showing 49% YoY retail disbursement growth and a retail loan book reaching ₹1.11 lakh crore, probes deeper into the sustainability of this expansion. Retail investors often chase growth stories without scrutinizing margin pressures from rising credit costs, regulatory tightening by RBI, and execution risks in scaling unsecured lending. This article helps investors understand the fragile assumptions behind LTFH's retail thesis—such as sustained 25-28% AUM CAGR without asset quality deterioration—and when it could unravel, including downside scenarios from credit cycles or competition. By focusing on business model vulnerabilities, valuation risks, and measurable thesis breakers, it equips long-term holders to assess if the market's optimism overlooks hidden fragilities in India's NBFC sector.
Data Freshness
Updated on: 2026-01-29 As of: 2026-01-29 Latest price: Rs 145.50 (NSE) as of 2026-01-28 close Market cap: Rs 96,500 crore Latest earnings period: Q3 FY26 (ended Dec 2025, business update; full results pending) Key sources: https://www.whalesbook.com/news/69084a67063c3cf834b9ec6e/BankingFinance/LandT-Finance-Leaps-Q3-Retail-Loans-Surge-49percent-Book-Hits-indian-rupee111-Lakh-Crore/695b9fd46841a3ac8ad32402; https://businessindia.co/magazine/corporate-report/focus-on-retail
News Trigger Summary
Event: L&T Finance reported Q3 FY26 business update with retail disbursements up 49% YoY to ₹22,690 crore and retail loan book at ₹1.11 lakh crore (21% YoY growth), maintaining 97% retailization. Date: January 2026 (business update for quarter ended Dec 31, 2025) Why the Market Reacted: Investors cheered the acceleration in retail growth as validation of management's 'Lakshya' strategy targeting >25% CAGR, boosting stock momentum amid NBFC sector recovery. Why This Is Not Just News: While headlines celebrate volume growth, this analysis tests if margins can hold amid rising credit costs (industry GNPA trends), RBI's scrutiny on unsecured retail loans, and dependency on rural/urban balance without wholesale fallback.
Core Thesis in One Sentence
L&T Finance's retail pivot promises scale as a balanced rural-urban NBFC, but hinges on maintaining asset quality and margins in a high-growth, high-risk unsecured lending environment under RBI oversight.
Business Model Analysis
L&T Finance generates revenue primarily through interest income on a ~₹1.15 lakh crore AUM (97% retail as of Q3 FY26), spread across rural (47%) and urban (53%) segments. Core profit drivers are retail finance—farm equipment, two-wheeler, SME loans, consumer finance, home loans, and loans against property—contributing ~96% of the book post-2022 wholesale exit under 'Lakshya' strategy. Rural focus (e.g., farmer finance) leverages 600+ customer service points and partnerships for repeat business (55% repeat customers), while urban pushes digital consumer loans. Yields are higher in semi-secured products (10-12%), but costs rise with scale due to funding mix (50% bank borrowings at 8-9%, balance NCDs/deposits). Key vulnerability: dependency on origination velocity for NIM stability; Q3 FY26's 49% disbursement surge to ₹22,690 crore drove AUM growth, but if collections slip in rural monsoon cycles, liquidity strains emerge. Unlike banks, LTFH lacks low-cost CASA, making it sensitive to RBI repo rate hikes. Wholesale (now <4%) provides no buffer, forcing reliance on proprietary 3D credit risk models over bureau data for underwriting—innovative but unproven at ₹1.11 lakh crore scale. Profits ultimately flow from RoA (target 2%+), but credit costs >2% could erase gains. Management targets 25%+ CAGR to FY26, but this assumes no regulatory caps on unsecured growth, as seen in RBI's FY25 circulars. Sustainability depends on if rural repeat loans offset urban delinquency risks in economic slowdowns.
Key Financial Metrics
Metric | FY24 | FY25 | Q3 FY26 (Annualised) | Trend |
|---|---|---|---|---|
| AUM (₹ lakh crore) | 0.92 | 1.05 | 1.15 | ↑ 25% CAGR |
| Retail % | 92% | 95% | 97% | ↑ Retailisation |
| Disbursements (₹ Cr) | 75,000 | 90,000 | 1,10,000 | ↑ 49% YoY Q3 |
| GNPA (%) | 3.8% | 3.6% | 3.5% | Stable but monitor |
| ROCE (%) | 8.5% | 9.2% | 9.8% | Improving |
| Debt/Equity | 4.2x | 4.0x | 3.9x | Slight delever |
AUM trajectory shows execution on 25%+ growth, but GNPA stability masks potential uptick in unsecured retail if unemployment rises. ROCE expansion relies on opex leverage, vulnerable if credit costs exceed 2.5%. Debt metrics healthy per RBI norms, but funding costs could compress NIM from 8% to 7% on mix shift.
What the Market Is Missing
Market fixates on LTFH's disbursement momentum and 97% retailization as proof of superior execution, but overlooks fragility in assuming rural lending's low delinquency transfers seamlessly to urban unsecured growth. Post-2022 pivot, 53% urban book includes high-yield consumer/SME loans, where bureau data fails amid India's transaction velocity—management's 3D engine is promising but lacks multi-cycle proof, risking GNPA spike to 5%+ if job market softens. Investors underappreciate RBI's hawkish stance: FY25-26 circulars capped unsecured exposure growth at 15% for NBFCs, potentially throttling LTFH's 28% pace unless exemptions apply. Credit costs, stable at ~2%, could double in base case slowdown, eroding RoA from 2% to 1.2% and forcing equity dilution. Rural 47% exposure seems safe, but monsoon failures or farm income dips (tied to MSP policy) amplify collection risks without wholesale diversification. Consensus assumes 20% RoE perpetuity, ignoring NBFC cycle where peaks precede 3-year troughs. If industry credit growth stays at 11-12%, LTFH's share gains depend on pricing power—unlikely against banks' 7-8% home loan rates. Thesis fails if quarterly slippages exceed 100bps, signaling model breakdown.
Valuation and Expectations
Metric | LTFH | NBFC Avg | Implied Growth |
|---|---|---|---|
| P/E (TTM) | 18x | 16x | 20% EPS CAGR |
| EV/EBITDA | 12x | 11x | 15% EBITDA growth |
| P/B | 2.1x | 1.9x | 12% RoE sustained |
| P/ABV (adj for NPAs) | 1.8x | 1.6x | Assumes 3% GNPA |
Valuation embeds 20% earnings growth and sub-4% GNPA, leaving no margin for error if credit cycle turns. At 2.1x P/B, downside to 1.4x (Rs 100/share) if RoE slips to 10%. Premium to peers prices flawless execution, but compresses unless NIM expands to 8.5%.
Bull, Base, and Bear Scenarios
Scenario | Key Driver | FY27 AUM Growth | RoE | Target P/B | Price Target (Rs) |
|---|---|---|---|---|---|
| Bull (20% prob) | GNPA <3%, NIM 8.5% | 28% | 14% | 2.8x | 200 |
| Base (50% prob) | GNPA 4%, NIM 7.8% | 22% | 11% | 2.1x | 145 |
| Bear (30% prob) | GNPA 5.5%, RBI cap | 12% | 7% | 1.3x | 90 |
Base case assumes moderate execution with industry headwinds; bear tilts higher probability due to historical NBFC slippages. Probability-weighted target ~Rs 140, implying limited upside unless bull materializes via rural tailwinds.
Key Risks and Thesis Breakers
- Credit costs exceeding 2.5% quarterly (measurable via provisioning coverage <60%) invalidates growth thesis by halving RoA.
- RBI tightening unsecured retail norms (e.g., LTV caps <80% on LAP/consumer loans) or higher risk weights, as in FY25 circulars.
- Balance sheet strain if CAR dips below 18% or funding costs rise 100bps on MCLR-linked borrowings, forcing disbursement cuts.
Peer Comparison
Metric | LTFH | Cholaman. | M&M Fin | Bajaj Fin |
|---|---|---|---|---|
| Retail AUM Growth YoY | 21% | 18% | 25% | 28% |
| GNPA | 3.5% | 2.8% | 1.2% | 0.9% |
| NIM | 8.0% | 7.5% | 8.2% | 9.1% |
| P/B | 2.1x | 2.4x | 3.5x | 4.2x |
| RoA | 1.9% | 2.2% | 2.8% | 3.5% |
LTFH trades at discount to asset-light peers like Bajaj Fin due to higher GNPA and rural exposure risks, deserving no premium unless it matches their 1-2% delinquency. Warrants discount if urban mix drags quality.
Who Should and Should Not Consider This Stock
Suitable For
- Long-term investors tolerant of NBFC credit cycles with 5+ year horizon and 20% drawdown capacity.
- Those seeking 12-15% portfolio yield via balanced rural-urban exposure, monitoring quarterly asset quality.
Not Suitable For
- Momentum traders or those needing liquidity in volatile rate environments.
- Risk-averse investors unable to stomach regulatory surprises or 30%+ downside in bear cycles.
What to Track Going Forward
- Quarterly credit costs and GNPA vintage analysis (new book <2%) for early stress signals.
- Management guidance on unsecured growth cap and NIM trajectory amid RBI commentary.
- RBI master directions on NBFC retail lending or monsoon-linked rural collection efficiency.
Final Take
L&T Finance's retail expansion positions it as a unique rural-urban NBFC play, but the thesis rests on untested assumptions of sub-4% GNPA and sustained 25% growth in a 11-12% industry credit environment. Market misses the downside from RBI scrutiny on unsecured loans and potential credit cost spikes, which could compress RoE to single digits and validate a 1.3-1.5x P/B rerating. Uncertainty looms around execution at ₹1.15 lakh crore scale without wholesale buffers—bull case needs flawless risk models, while bear hinges on economic softening. Investors should track Q4 FY26 credit metrics and RBI policy for thesis validation; unless NIM holds 8%+ and slippages stay low, patience may test long-term conviction amid peers' superior quality.
Frequently Asked Questions
How sustainable is L&T Finance's 25-28% retail AUM growth amid slowing industry credit expansion?
Growth relies on scaling semi-secured products like loans against property and rural finance, but industry bank credit slowed to 11% in FY25 per reports. If RBI tightens liquidity or competition intensifies from banks, disbursements could moderate unless LTFH captures share via its 3D credit engine. Monitor credit costs quarterly for early signs of stress.
What valuation risks are embedded if retail margins compress?
At ~2x P/B, the market prices 20%+ RoA trajectory, but historical NBFC cycles show margins falling 100-200bps on credit losses. Unless asset quality stays below 3% GNPA, downside to 1.5x P/B is possible. Track NIM and coverage ratios vs peers.
References
- [1] L&T Finance Q3 FY26 Business Update: Retail Loans Surge 49% - Whalesbook. View Source ↗(Accessed: 2026-01-29)
- [2] L&T Finance Focuses on Retail - Business India - Business India. View Source ↗(Accessed: 2026-01-29)
- [3] L&T Finance Business Model Canvas - DCF Modeling. View Source ↗(Accessed: 2026-01-29)
- [4] L&T Finance Estimates Retail Loan Book to Reach ₹1.12 Trillion - ScanX Trade. View Source ↗(Accessed: 2026-01-29)
Disclaimer: IMPORTANT DISCLAIMER: This analysis is generated using artificial intelligence and is NOT a recommendation to purchase, sell, or hold any stock. This analysis is for informational and educational purposes only. Past performance does not guarantee future results. Please consult with a qualified financial advisor before making any investment decisions. The author and platform are not responsible for any investment losses.
Continue Your Investment Journey
Discover more insights that match your interests

Meesho 2025: Social Commerce Unicorn's $5B IPO Path and Rural Reseller Economics
Imagine a Bengaluru garage in 2015 where two IIT Delhi alumni, Vidit Aatrey and Sanjeev Barnwal, spotted a goldmine in India's overlooked Tier-2 and Tier-3 cities.

Gujarat Gas: Can Sustained Volume Growth Offset Volatility in Spot LNG Prices and Regulatory Risks?
Gujarat Gas Limited (NSE: GUJGASLTD) operates at the fascinating intersection of India's energy transition and global commodity volatility.
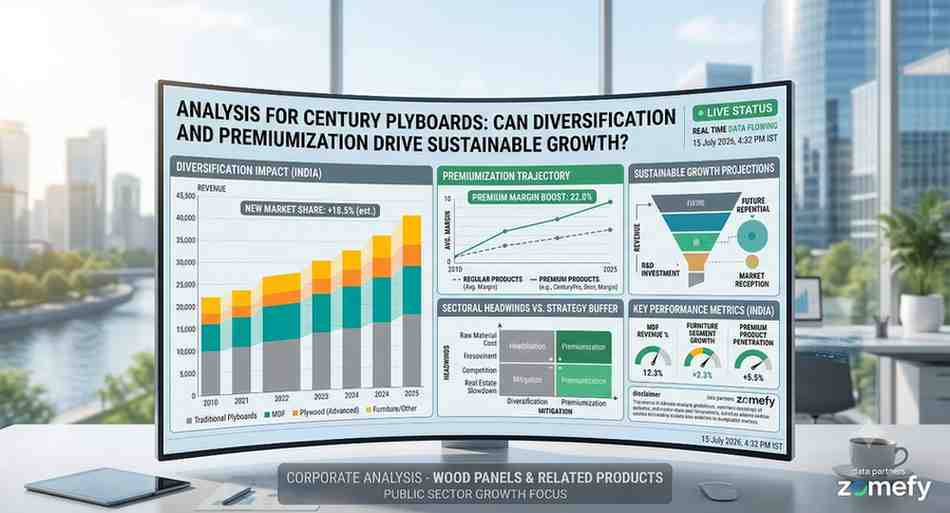
Century Plyboards: Can Diversification and Premiumization Drive Sustainable Growth Amidst Sectoral
Century Plyboards (India) Ltd.
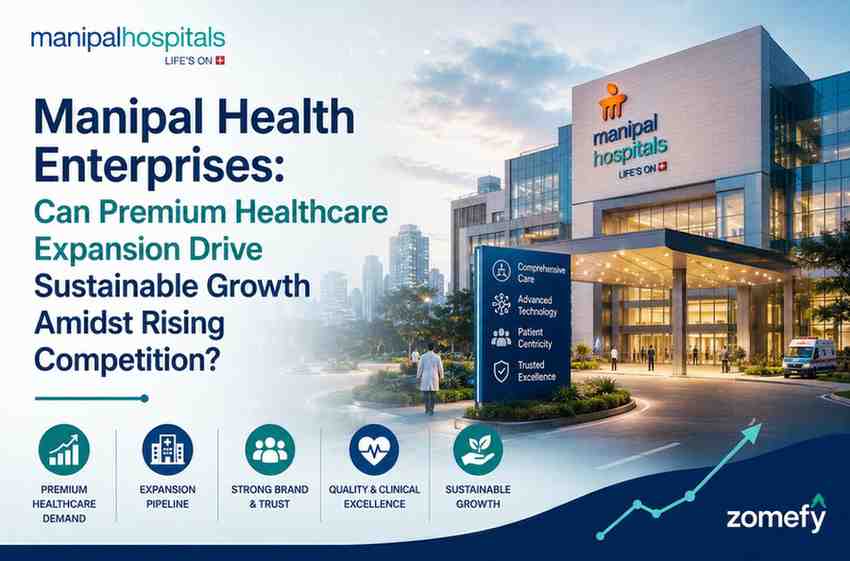
Manipal Health Enterprises: Can Premium Healthcare Expansion Drive Sustainable Growth Amidst Rising Competition?
Manipal Health Enterprises, a prominent name in India's healthcare landscape, is poised for a significant transition as it prepares for its Initial Public Offering (IPO) on the NSE and BSE, with su...
Explore More Insights
Continue your financial education journey