Kalyan Jewellers: Can Premiumization Strategy Drive Sustainable Margins Amidst Gold Price Volatility
Kalyan Jewellers India Ltd. (NSE: KALYANKJIL) has emerged as a significant player in India's organized jewellery retail sector, known for its extensive.
Kalyan Jewellers: Can Premiumization Strategy Drive Sustainable Margins Amidst Gold Price Volatility
What You Can Do Next
- Read the full article for complete insights
- Save for later reference
- Share with others learning about this topic
Image not available
Kalyan Jewellers India Ltd. (NSE: KALYANKJIL) has emerged as a significant player in India's organized jewellery retail sector, known for its extensive network and diversified product portfolio. The company's strategy of blending traditional designs with modern appeal, coupled with a strong emphasis on customer trust and transparency, positions it uniquely in a market traditionally dominated by unorganized players. This analysis aims to go beyond the recent headlines of robust financial performance to explore the underlying business fundamentals, the sustainability of its premiumization strategy, and the inherent risks, particularly those associated with gold price volatility. Indian retail investors often seek growth stories, but a thorough understanding of potential downsides and key assumptions is crucial for long-term wealth creation. This article will help investors understand what the market might be overlooking and under what conditions Kalyan Jewellers' investment thesis could falter.
Data Freshness
Updated on: 2026-07-04 As of: 2026-07-04 Latest price: Rs 382.05 (NSE) as of July 3, 2026, 4:01 PM IST Market cap: Rs 39,435 crore Latest earnings period: FY26 Q4 Key sources: https://www.tradingview.com/symbols/NSE-KALYANKJIL/; https://economictimes.indiatimes.com/markets/stocks/news/kalyan-jewellers-q4-results-cons-pat-soars-118-yoy-to-rs-409-crore-revenue-jumps-66/articleshow/109941168.cms; https://groww.in/stocks/kalyan-jewellers-india-ltd
News Trigger Summary
Event: Kalyan Jewellers India Ltd. announced strong financial results for the fourth quarter and full fiscal year ended March 31, 2026 (FY26). Date: May 8, 2026 Why the Market Reacted: The market reacted positively to Kalyan Jewellers' Q4 FY26 results, which showed a significant 118.2% year-on-year (YoY) increase in consolidated net profit to Rs 409.5 crore and a 66.2% YoY surge in revenue from operations to Rs 10,274.9 crore. The EBITDA also grew by 84.2%, with margins improving to 7.2%, signaling robust operational performance and effective cost management. The company also recommended a final dividend of Rs 2.50 per equity share for FY26. Why This Is Not Just News: While these strong quarterly numbers are encouraging, they primarily reflect short-term performance. This article delves deeper into whether the drivers behind this growth, particularly the premiumization strategy and efficiency gains, are sustainable over the long term. It aims to analyze if the current market valuation fully discounts these factors, or if there are underlying risks related to gold price volatility, intense competition, and execution challenges that warrant a more cautious outlook than the immediate positive reaction suggests. Understanding the durability of these trends is critical for long-term investors, rather than simply reacting to a single quarter's performance.
Core Thesis in One Sentence
Kalyan Jewellers' ability to sustain its premiumization-led margin expansion and robust revenue growth hinges critically on its execution in non-South Indian markets and efficient inventory management amidst volatile gold prices, rather than just favorable market tailwinds.
Business Model Analysis
Kalyan Jewellers operates on a multi-format retail model, offering a diverse range of gold, diamond, platinum, and silver jewellery. Its business model is built on a foundation of customer trust and transparency, a critical factor in the Indian jewellery market. The company caters to a broad spectrum of customers through its extensive network of showrooms across India and a growing international presence in the Middle East and USA. As of December 31, 2025, Kalyan had 469 showrooms, including 318 in India. A key aspect of its strategy is regional targeting, with localized designs and marketing campaigns to resonate with diverse cultural preferences across India. The company also leverages its online e-commerce platform, Candere, which complements its physical stores by offering digital convenience and exclusive online collections. This omni-channel approach has been instrumental in expanding its market reach and catering to a digitally-inclined customer base. Kalyan Jewellers primarily generates revenue through retail sales of jewellery, with significant margins on gold and diamond pieces. The firm also offers financial services like gold loans and advance gold schemes, which diversify its revenue mix and enhance customer retention. A substantial portion of its operating expenses is tied to the cost of goods sold, primarily gold and precious stones, which necessitates efficient supply chain management and strategic sourcing. The company utilizes gold metal loans to finance a portion of its inventory, a common industry practice to manage working capital.
Key Financial Metrics
Metric (Rs Crore) | FY25 | FY26 | YoY Growth (FY26) |
|---|---|---|---|
| Revenue from Operations | 25,045.0 | 35,743.0 | 42.7% |
| EBITDA | 1,760.0 | 2,570.0 | 46.0% |
| PAT | 714.0 | 1,350.0 | 89.1% |
| EBITDA Margin (%) | 7.0% | 7.2% | +0.2 pp |
| PAT Margin (%) | 2.9% | 3.8% | +0.9 pp |
| ROE (%) | 15.0% | 21.4% | +6.4 pp |
| ROCE (%) | 17.0% | 20.5% | +3.5 pp |
Kalyan Jewellers has demonstrated robust financial performance, with revenue from operations growing by an impressive 42.7% from FY25 to FY26, reaching Rs 35,743 crore. This growth has translated into even stronger profitability, with PAT nearly doubling (89.1% growth) from Rs 714 crore in FY25 to Rs 1,350 crore in FY26. The significant jump in PAT outstripping revenue growth indicates a notable expansion in margins. EBITDA margin improved from 7.0% in FY25 to 7.2% in FY26, while PAT margin saw a more substantial increase from 2.9% to 3.8%. This margin expansion suggests operational efficiencies and potentially a favorable product mix towards higher-margin studded or design-led jewellery, aligning with its premiumization strategy. Furthermore, return ratios like Return on Equity (ROE) and Return on Capital Employed (ROCE) have shown healthy improvement, with ROE rising from 15.0% in FY25 to 21.4% in FY26 and ROCE from 17.0% to 20.5% in the same period. These trends indicate effective capital deployment and enhanced shareholder value creation. The strong Q4 FY26 results, with a 66.2% YoY revenue growth and 118.2% YoY PAT growth, underscore the momentum carried into the end of the fiscal year.
What the Market Is Missing
The market's current optimism around Kalyan Jewellers largely stems from its impressive growth trajectory and margin expansion, often attributing it solely to a successful premiumization strategy and the broader formalization of the Indian jewellery market. However, investors might be underestimating several fragile assumptions. Firstly, while premiumization contributes to higher margins, the extent to which this is driven by genuine shift in consumer preference versus opportunistic inventory gains during periods of rising gold prices is critical. Gold prices have seen significant volatility, with notable increases in recent years, which can lead to inventory revaluation gains, temporarily inflating reported profits. A reversal in gold price trends could expose the underlying margin strength. Secondly, the sustainability of growth in non-South Indian markets, where cultural preferences and competitive landscapes differ significantly, is a key unknown. While Kalyan is expanding aggressively, replicating its South Indian success requires nuanced execution and substantial marketing spend, which could pressure future margins. Thirdly, the 'old gold exchange' mechanism, a significant contributor to sales for many jewellers, including Senco Gold where it accounted for 43% of Q1 FY27 sales, implicitly reduces the 'new gold' demand. If this trend intensifies, it could cap fresh volume growth and increase reliance on making charges, which are more susceptible to competitive pressures. The market also appears to be underplaying the intense competition from both large organized players like Titan, with its strong brand equity, and numerous regional players who retain strong local loyalties. Sustaining market share and pricing power in such an environment demands continuous innovation and aggressive marketing, which are not without costs or risks. Finally, the rapid store expansion, while a growth driver, also entails significant working capital requirements and execution risks, especially in managing a vast and geographically dispersed inventory of high-value goods, which is partly financed by gold metal loans.
Valuation and Expectations
Metric | Kalyan Jewellers (FY26 TTM) | Industry Median |
|---|---|---|
| P/E (x) | 29.2 | ~35-40 |
| EV/EBITDA (x) | 16.5 | ~20-25 |
| P/B (x) | 6.3 | ~5-7 |
| ROE (%) | 21.4% | ~15-20% |
Kalyan Jewellers currently trades at a P/E multiple of approximately 29.2x its FY26 TTM earnings, which is somewhat below the higher end of the broader consumer discretionary or organized retail industry median, but still reflects healthy growth expectations. Its EV/EBITDA of around 16.5x also suggests that the market is pricing in continued operational efficiency and scalability. The Price-to-Book (P/B) ratio of 6.3x, coupled with a robust ROE of 21.4%, indicates that the market values the company's ability to generate strong returns on its equity. These valuations imply that investors are anticipating sustained revenue growth in the high teens to low twenties, along with a gradual, yet consistent, improvement in EBITDA margins, driven by the premiumization strategy and market formalization. Any significant deceleration in growth or reversal in margin trends could lead to a re-rating of these multiples. The current valuation does not leave much room for execution missteps or unforeseen macroeconomic headwinds, suggesting that a substantial portion of future positive outcomes is already baked into the price.
Bull, Base, and Bear Scenarios
Scenario | FY27 Revenue (Rs Crore) | FY27 EBITDA (Rs Crore) | FY27 PAT (Rs Crore) | Key Assumptions |
|---|---|---|---|---|
| Bull Case | 45,000 - 47,000 | 3,500 - 3,700 | 1,800 - 2,000 | Strong domestic demand (weddings, festivals), successful non-South expansion, sustained premiumization, stable gold prices, 8%+ EBITDA margin. |
| Base Case | 40,000 - 42,000 | 3,000 - 3,200 | 1,500 - 1,650 | Steady market share gains, moderate discretionary spending, continued but slower margin expansion, some gold price volatility, 7.5% EBITDA margin. |
| Bear Case | 36,000 - 38,000 | 2,400 - 2,600 | 1,000 - 1,150 | Weak consumer sentiment, intense competition, significant gold price volatility impacting margins, slowdown in expansion, 6.5% EBITDA margin. |
The probability-weighted outcomes for Kalyan Jewellers in FY27 present a range of possibilities, each contingent on specific assumptions. In a Bull Case, a confluence of strong festive and wedding demand, coupled with highly successful penetration into non-South Indian markets and sustained traction for premium offerings, could drive revenue to Rs 45,000-47,000 crore. This scenario assumes stable gold prices and a further expansion of EBITDA margins to 8%+, leading to PAT of Rs 1,800-2,000 crore. This outcome would be driven by superior execution and a favorable macro environment. The Base Case anticipates a more realistic scenario, with revenue growing to Rs 40,000-42,000 crore. This assumes steady market share gains from unorganized players, moderate growth in discretionary spending, and a continued, albeit slower, margin expansion to approximately 7.5% EBITDA. PAT in this scenario would range from Rs 1,500-1,650 crore, reflecting a consistent, but not extraordinary, performance. The Bear Case outlines a challenging environment where weak consumer sentiment, possibly triggered by economic slowdown or prolonged gold price volatility, dampens demand. Intense competition and execution hurdles in new geographies could lead to revenue stagnation at Rs 36,000-38,000 crore and a contraction in EBITDA margins to 6.5%, resulting in PAT of Rs 1,000-1,150 crore. This scenario highlights the sensitivity of the business to external factors and internal execution.
Key Risks and Thesis Breakers
Peer Comparison
Company | Market Cap (Rs Crore) | FY26 Revenue (Rs Crore) | FY26 PAT (Rs Crore) | FY26 P/E (x) | FY26 PAT Margin (%) |
|---|---|---|---|---|---|
| Titan Company Ltd | 3,93,023 | 88,136 | 5,073 | 83.7 | 5.8% |
| Kalyan Jewellers | 39,435 | 35,743 | 1,350 | 29.2 | 3.8% |
| Senco Gold Ltd | 2,550 | ~9,660 (TTM) | 581 | 4.4 (Q4FY26 EPS) | 6.0% (FY26) |
| Rajesh Exports Ltd | 2,806 | 2,37,105 | 32 | 87.7 (TTM) | 0.01% |
Comparing Kalyan Jewellers with its peers reveals a nuanced picture. Titan Company Ltd, the market leader, commands a significantly higher market capitalization and P/E multiple (83.7x) due to its diversified portfolio beyond jewellery (watches, eyewear), strong brand equity (Tanishq), and consistent track record of premiumization and operational excellence, resulting in a higher PAT margin of 5.8%. Kalyan Jewellers, while smaller in scale, has demonstrated robust revenue growth and improving margins, reflected in its P/E of 29.2x. This valuation suggests the market acknowledges its growth potential but also perhaps factors in its more concentrated jewellery focus and relatively newer pan-India expansion compared to Titan. Senco Gold, a smaller but fast-growing regional player, shows a strong PAT margin of 6.0% for FY26, indicating efficient operations, but its market cap is considerably smaller. Rajesh Exports, despite reporting a very high revenue figure (likely due to its B2B gold trading and refining business), exhibits a very low PAT margin of 0.01% and has faced profitability challenges, including a Q4 FY26 loss, leading to a much lower overall valuation perception despite a high P/E due to low earnings. Kalyan's valuation thus appears to strike a balance, pricing in its growth story and increasing formalization benefits, but without the premium commanded by Titan's broader diversified business and established leadership. Its ability to justify a higher premium will depend on sustaining margin expansion and demonstrating consistent profitable growth in new markets.
Who Should and Should Not Consider This Stock
Suitable For
- Long-term investors seeking exposure to India's organized retail jewellery growth story, who are comfortable with cyclicality and willing to monitor execution risks.
- Growth-oriented investors who believe Kalyan Jewellers can continue to gain market share from unorganized players and successfully expand its premiumization strategy across diverse geographies.
- Investors with a moderate-to-high risk appetite, understanding the impact of commodity price volatility and competitive pressures on the business.
Not Suitable For
- Short-term traders or investors seeking quick gains, as the stock can be influenced by gold price fluctuations and broader market sentiment.
- Conservative investors averse to cyclical businesses and those sensitive to commodity price risks.
- Investors looking for a highly diversified business model that offers insulation from sector-specific headwinds, unlike Titan.
What to Track Going Forward
Final Take
Kalyan Jewellers has demonstrated commendable growth and margin expansion, driven by its strategic focus on premiumization and expanding retail footprint. The strong Q4 FY26 results validate its operational capabilities and the increasing formalization of India's jewellery market. However, investors should approach the stock with a discerning eye, recognizing that a significant portion of this positive outlook may already be priced into its current valuation. The sustainability of its premiumization strategy, particularly in diverse non-South Indian markets, is a key determinant of future profitability. The true test lies in maintaining margin resilience against potential gold price volatility and intensifying competition, rather than simply benefiting from market tailwinds. While the company's emphasis on trust and localized designs offers a competitive edge, execution risks associated with rapid expansion and efficient inventory management remain pertinent. Long-term investors should prioritize consistent same-store sales growth, stable or improving margins, and prudent working capital management as critical indicators of whether Kalyan Jewellers can truly deliver sustainable value beyond the current optimistic narrative.
Frequently Asked Questions
How does Kalyan Jewellers' premiumization strategy mitigate gold price volatility?
Kalyan Jewellers' premiumization strategy, focusing on studded and design-led jewellery, aims to increase the value-added component of sales, thereby reducing direct sensitivity to fluctuations in plain gold prices. By emphasizing craftsmanship and unique designs, the company can command better margins, as the labor and design charges become a larger proportion of the overall selling price. However, this strategy is not a complete hedge, as significant gold price swings can still influence consumer demand and inventory valuation.
What are the key valuation risks for Kalyan Jewellers given its recent performance?
The primary valuation risk for Kalyan Jewellers lies in the market potentially extrapolating recent high growth rates and margin expansion too aggressively. While Q4 FY26 saw significant profit growth, sustaining such high growth in a competitive and cyclical industry like jewellery, especially with fluctuating gold prices, can be challenging. Investors need to assess if the current multiples adequately account for potential slowdowns in consumer discretionary spending, increased competition, or any reversal in gold price trends that could impact inventory gains or losses.
References
- [1] Kalyan Jewellers India Ltd. - TradingView - TradingView. View Source ↗(Accessed: 2026-07-04)
- [2] Kalyan Jewellers Q4 Results: Cons PAT soars 118% YoY to Rs 409 crore; revenue jumps 66% - The Economic Times - The Economic Times. View Source ↗(Accessed: 2026-07-04)
- [3] Kalyan Jewellers Stock Price Live NSE/BSE - Groww - Groww. View Source ↗(Accessed: 2026-07-04)
- [4] Kalyan Jewellers Q4 Results: PAT Jumps 118% to ₹409 Crore - Kotak Neo - Kotak Neo. View Source ↗(Accessed: 2026-07-04)
- [5] Kalyan Jewellers India (KALYANKJIL.NS) - Market capitalization - Companies Market Cap - Companies Market Cap. View Source ↗(Accessed: 2026-07-04)
- [6] Kalyan Jewellers Q4 Results: Net profit jumps 118% YoY to ₹409.5 crore; co declares ₹2.5/share final dividend | Stock Market News - Mint - Mint. View Source ↗(Accessed: 2026-07-04)
- [7] Historical Gold Rate/Trend in India - Complete Information - BankBazaar - BankBazaar. View Source ↗(Accessed: 2026-07-04)
- [8] Kalyan Jewellers Q4 Results: Net Profit More Than Doubles To Rs 410 Crore, Revenue Up 66%; Dividend Declared - NDTV Profit. View Source ↗(Accessed: 2026-07-04)
- [9] Kalyan Jewellers Q4 Result: Net profit multifold at ₹410 crore YoY; board recommends final dividend of ₹2.5/per share for FY26 - Upstox - Upstox. View Source ↗(Accessed: 2026-07-04)
- [10] Kalyan Jewellers: Business Model Canvas – MatrixBCG.com - MatrixBCG.com. View Source ↗(Accessed: 2026-07-04)
- [11] Kalyan Jewellers Ind Ltd Share Price Today Live NSE/BSE - Bajaj Finserv - Bajaj Finserv. View Source ↗(Accessed: 2026-07-04)
- [12] Kalyan Jewellers: Business Model Canvas - PESTEL Analysis - PESTEL Analysis. View Source ↗(Accessed: 2026-07-04)
- [13] Kalyan Jewellers Business Model - Business Strategy Canvas - Vizologi - Vizologi. View Source ↗(Accessed: 2026-07-04)
- [14] Kalyan Jewellers Case Study: Business Model, Marketing Strategy & SWOT - Pocketful.in - Pocketful.in. View Source ↗(Accessed: 2026-07-04)
- [15] Investor PresentationQ4_signed.pdf - Kalyan Jewellers - Kalyan Jewellers Investor Relations. View Source ↗(Accessed: 2026-07-04)
- [16] Kalyan Jewellers India Ltd share price - Screener - Screener.in. View Source ↗(Accessed: 2026-07-04)
- [17] Kalyan Jewellers India Share Price - The Economic Times - The Economic Times. View Source ↗(Accessed: 2026-07-04)
- [18] INVESTOR PRESENTATION - Kalyan Jewellers - Kalyan Jewellers Investor Relations. View Source ↗(Accessed: 2026-07-04)
- [19] Kalyan Jewellers Set To Announce Q4 FY26 Earnings On May 8, Final Dividend Likely in Focus - NDTV Profit - NDTV Profit. View Source ↗(Accessed: 2026-07-04)
- [20] Senco Gold's Q1 revenue jumps 60%, opens 8 showrooms as festive demand boosts sales - Business Standard. View Source ↗(Accessed: 2026-07-04)
- [21] Gold Rate Today in India - The Economic Times - The Economic Times. View Source ↗(Accessed: 2026-07-04)
- [22] Senco Gold Q1 Revenue Grows as Old Gold Exchange Hits 43% of Total Sales - Sahi - Sahi. View Source ↗(Accessed: 2026-07-04)
- [23] Gold Rates Today: Gold Price in India Live & Updates - NDTV - NDTV. View Source ↗(Accessed: 2026-07-04)
- [24] Kalyan Jewellers India Ltd Share Price Today Live NSE/BSE - INDmoney - INDmoney. View Source ↗(Accessed: 2026-07-04)
- [25] Senco Gold Q1 update: Revenue jumps 60% on festive demand; SSSG at 38%, 8 new showrooms opened | Stock Market News - Mint - Mint. View Source ↗(Accessed: 2026-07-04)
- [26] Rajesh Exports Financial Results - Annual, Quarterly and Half-Yearly - Anand Rathi - Anand Rathi. View Source ↗(Accessed: 2026-07-04)
- [27] Kalyan Jewellers India Ltd share price - Screener - Screener.in. View Source ↗(Accessed: 2026-07-04)
- [28] Should You Invest in Kalyan Jewellers Ltd? - Recipe by Finology - Finology. View Source ↗(Accessed: 2026-07-04)
- [29] Kalyan Jewellers Annual Report 2024-25 | PDF | Expense | Equity (Finance) - Scribd - Scribd. View Source ↗(Accessed: 2026-07-04)
- [30] NSE:SENC Financials | Senco Gold Ltd - Investing.com - Investing.com. View Source ↗(Accessed: 2026-07-04)
- [31] Kalyan Jewellers Investor Presentation 2025 | PDF | Jewellery | Risk - Scribd - Scribd. View Source ↗(Accessed: 2026-07-04)
- [32] Rajesh Exports - Quarterly Results and Financial Statement as of Mar, 2026 - Trendlyne.com - Trendlyne. View Source ↗(Accessed: 2026-07-04)
- [33] Gold Spot Price & Charts in Indian Rupees - JM Bullion - JM Bullion. View Source ↗(Accessed: 2026-07-04)
- [34] Kalyan Jewellers India Ltd Stock Live on NSE/BSE - Axis Direct - Axis Direct. View Source ↗(Accessed: 2026-07-04)
- [35] Kalyan Jewellers India Ltd Results 2025 - INDmoney - INDmoney. View Source ↗(Accessed: 2026-07-04)
- [36] Kalyan Jewellers - Quarterly Results - Trendlyne.com - Trendlyne. View Source ↗(Accessed: 2026-07-04)
- [37] Senco Gold - Quarterly Results and Financial Statement as of Mar, 2026 - Trendlyne.com - Trendlyne. View Source ↗(Accessed: 2026-07-04)
- [38] Quarterly Update – Q3 FY 2025-2026 - Kalyan Jewellers - Kalyan Jewellers Investor Relations. View Source ↗(Accessed: 2026-07-04)
- [39] Gold price historical data in India (2000 to 2026) - Forbes India - Forbes India. View Source ↗(Accessed: 2026-07-04)
- [40] Kalyan Jewellers India Ltd. Investor Presentation - Trendlyne.com - Trendlyne. View Source ↗(Accessed: 2026-07-04)
- [41] Rajesh Exports (RAJESHEXPO.NS) - Earnings - Companies Market Cap - Companies Market Cap. View Source ↗(Accessed: 2026-07-04)
- [42] Kalyan Jewellers - Investor Presentations - Trendlyne.com - Trendlyne. View Source ↗(Accessed: 2026-07-04)
- [43] Rajesh Exports Share Price - The Economic Times - Indiatimes - The Economic Times. View Source ↗(Accessed: 2026-07-04)
- [44] Rajesh Exports Financial Statements - Check Balance Sheet & EBITDA - Groww - Groww. View Source ↗(Accessed: 2026-07-04)
- [45] Kalyan Jewellers Annual Report 2024-25 | PDF | Jewellery | Brand - Scribd - Scribd. View Source ↗(Accessed: 2026-07-04)
- [46] Titan Company Q4 FY26 Results: PAT Jumps 35% YoY, ₹15 Dividend Announced - Sahi - Sahi. View Source ↗(Accessed: 2026-07-04)
- [47] Titan Company Q4 FY26 slides: jewellery surge drives 46% revenue growth - Investing.com - Investing.com. View Source ↗(Accessed: 2026-07-04)
- [48] Titan Q4 Results 2026: Net profit jumps 35.4% YoY to ₹1,179 crore; co declares ₹15/share dividend | Stock Market News - Mint - Mint. View Source ↗(Accessed: 2026-07-04)
- [49] Titan Company's Q4 FY 2025-26 Latest Quarterly Results & Earnings | Kotak Neo - Kotak Neo. View Source ↗(Accessed: 2026-07-04)
- [50] Titan Q4 FY26 Results: PAT Rs 1179 Crore Up 35 Percent Revenue Crosses Rs 20300 Crore - Univest - Univest. View Source ↗(Accessed: 2026-07-04)
- [51] Q4FY26 - Financial results Uploaded_0.pdf - Titan Company - Titan Company Investor Relations. View Source ↗(Accessed: 2026-07-04)
- [52] Titan Company reports ₹5073 crore consolidated profit, declares ₹15 dividend - Trendlyne. View Source ↗(Accessed: 2026-07-04)
- [53] Titan Company Annual Report 2026 — AI Summary & Analysis - Tikr.com. View Source ↗(Accessed: 2026-07-04)
Disclaimer: IMPORTANT DISCLAIMER: This analysis is generated using artificial intelligence and is NOT a recommendation to purchase, sell, or hold any stock. This analysis is for informational and educational purposes only. Past performance does not guarantee future results. Please consult with a qualified financial advisor before making any investment decisions. The author and platform are not responsible for any investment losses.
Continue Your Investment Journey
Discover more insights that match your interests
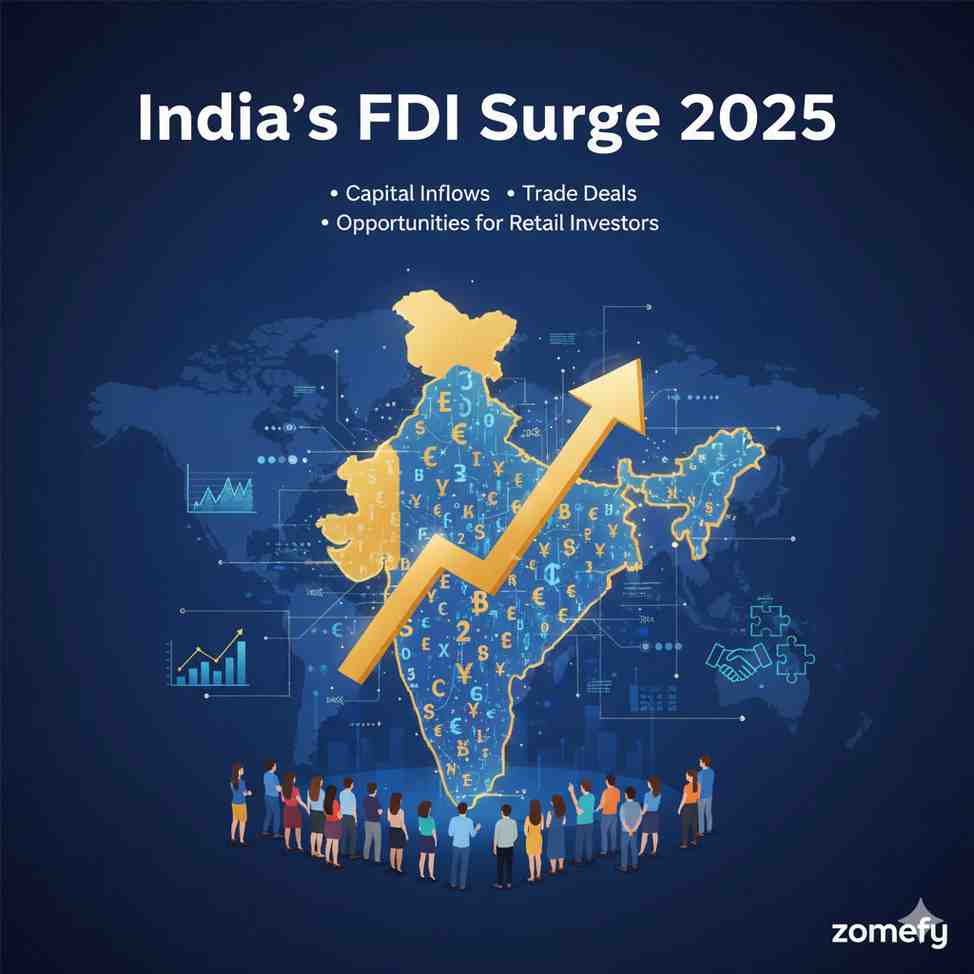
India’s FDI Surge 2025: Capital Inflows, Trade Deals, and Opportunities for Retail Investors
India’s FDI surge in 2025 represents a meaningful inflection point for domestic capital markets and retail investors as policy, trade deals and targeted incentives have combined to lift gross inflo...
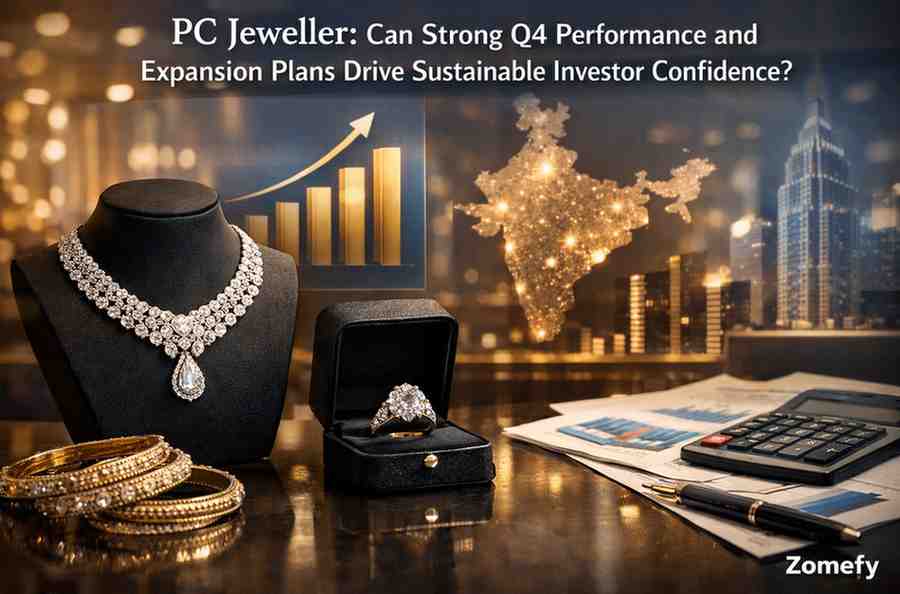
PC Jeweller: Can Strong Q4 Performance and Expansion Plans Drive Sustainable Investor Confidence?
PC Jeweller Limited (NSE: PCJEWELLER) has been a name that evokes both recognition and caution among Indian retail investors.

Trent Stock Analysis 2025: Record Q3 Fashion Sales Surge & Zudio Expansion Ignite Multibagger Rally
Trent Limited (NSE: TRENT), the Tata Group's powerhouse in organized retail, has ignited investor excitement with its blockbuster Q3 FY25 results announced recently, showcasing a staggering 33% YoY...
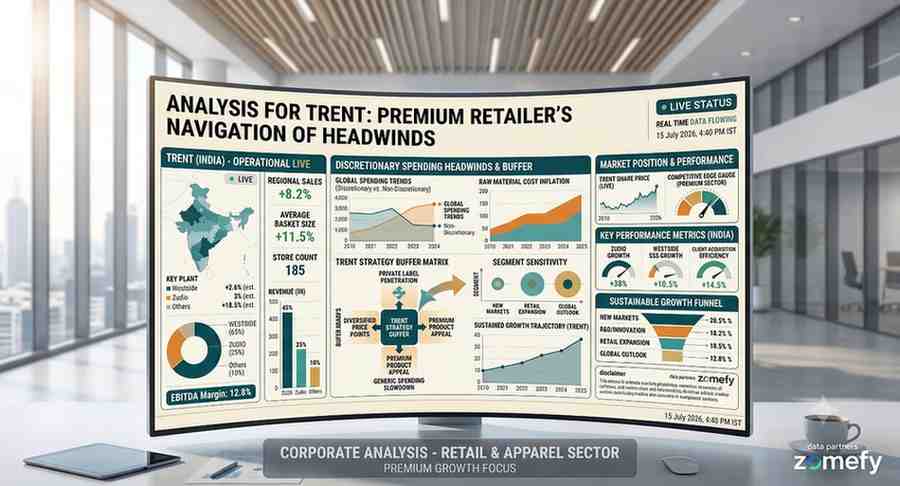
Trent: Can Premium Retailer Navigate Discretionary Spending Headwinds and Sustain Growth Momentum?
Trent Limited, a prominent Tata Group retailer, has carved a significant niche in India's burgeoning fashion and lifestyle segment through its distinct brands like Westside and the rapidly expandin...
Explore More Insights
Continue your financial education journey