Kajaria Ceramics: Can Share Buyback Programs Drive Long-Term Shareholder Value Amidst Sector
Kajaria Ceramics, India's largest manufacturer of ceramic and vitrified tiles, recently announced its Q4 FY26 results, reporting a significant surge in.
Kajaria Ceramics: Can Share Buyback Programs Drive Long-Term Shareholder Value Amidst Sector
What You Can Do Next
- Read the full article for complete insights
- Save for later reference
- Share with others learning about this topic
Image not available
Kajaria Ceramics, India's largest manufacturer of ceramic and vitrified tiles, recently announced its Q4 FY26 results, reporting a significant surge in profitability alongside a share buyback program. This development, while seemingly positive, serves as a crucial trigger for a deeper examination beyond the headlines. For Indian retail investors, understanding Kajaria's long-term value proposition requires dissecting its business fundamentals, critically evaluating its capital allocation strategies like buybacks, and identifying potential risks often overshadowed by growth narratives. This article aims to provide a non-consensus view, focusing on the sustainability of its competitive advantages, the inherent cyclicality of the building materials sector, and the assumptions that underpin its current valuation, helping investors navigate the complexities of this investment.
Data Freshness
Updated on: 2026-06-26 As of: 2026-06-25 Latest price: Rs 1,196.60 (NSE) as of June 25, 2026 Market cap: Rs 19,059 crore Latest earnings period: FY26 Q4 (Jan-Mar 2026) Key sources: https://www.screener.in/company/KAJARIACER/; https://economictimes.indiatimes.com/kajaria-ceramic-ltd/stocks/companyid-13008.cms; https://sahi.ai/stocks/kajaria-ceramics-q4-results-fy26-profit-jumps-260-cr-buyback-dividend-announced
News Trigger Summary
Event: On April 30, 2026, Kajaria Ceramics announced its Q4 FY26 financial results, reporting a 262% year-on-year surge in consolidated net profit to ₹156.56 crore and a 12.4% rise in revenue to ₹1,373 crore. Concurrently, the board approved its first-ever share buyback program of up to ₹296.7 crore to repurchase 21.5 lakh equity shares at a price of ₹1,380 per share, representing approximately 1.35% of the total paid-up capital. A final dividend of ₹6 per share was also declared. Date: April 30, 2026 (announcement date) Why the Market Reacted: The market's initial reaction was mixed; despite strong operational performance, the stock reportedly fell by nearly 4% on the announcement day. Investors may have perceived the buyback price as not offering a substantial enough premium, or perhaps broader market sentiment and concerns about the overall real estate and building materials sector influenced the reaction, overshadowing the robust earnings. Why This Is Not Just News: While the buyback and strong quarterly results are significant, this article delves beyond the immediate news. A share buyback, especially the first for a company, raises questions about capital allocation priorities, future growth avenues, and management's perception of intrinsic value. This analysis will explore whether the buyback is a strategic move to enhance long-term shareholder value or a signal of limited high-return investment opportunities, examining the underlying business fundamentals and sector dynamics that will truly drive shareholder returns over the next 6-12 months, irrespective of short-term news cycles.
Core Thesis in One Sentence
Kajaria Ceramics' dominant market position and recent profitability surge, amplified by a share buyback, suggest a strengthening in the organised tile sector, yet its long-term value hinges on sustained demand, pricing power against evolving competition, and prudent capital allocation beyond buybacks in a cyclical and input-cost-sensitive industry.
Business Model Analysis
Kajaria Ceramics operates as India's largest manufacturer of ceramic and vitrified tiles, a position it has built through a diversified product portfolio and an extensive distribution network. The company primarily generates revenue from the sale of ceramic wall and floor tiles, polished vitrified tiles, and glazed vitrified tiles, which constituted approximately 89% of its total turnover in FY26. Beyond tiles, Kajaria has strategically diversified into allied segments such as bathware (faucets and sanitaryware) and tile adhesives, though these contribute a smaller portion (around 11%) to the overall revenue.
The company employs a 'hub-and-spoke' manufacturing model, integrating owned plants, subsidiaries, and joint ventures across India, which helps optimize regional logistics and cater to diverse market demands. Key manufacturing locations include Sikandrabad, Gailpur, Morbi, and Srikalahasti, with an aggregate tile production capacity of 90.50 million square meters as of March 2025. This scale provides significant operational leverage and cost efficiencies. Kajaria's brand strength is underpinned by its vast network of over 1,900 dealers and numerous exclusive showrooms, catering to homeowners, architects, and institutional builders.
Profitability in this business is highly sensitive to raw material costs (like clay, feldspar, silica) and energy prices (natural gas), which are significant components of manufacturing expenses. The company's focus on value-added products like Glazed Vitrified Tiles (GVT) and continuous investment in advanced digital printing technology and automated production lines are critical for maintaining margins and market leadership. The recent disruption in the unorganised sector, particularly in regions like Morbi, has also benefited organised players like Kajaria, allowing them to gain market share and improve realisations. However, the cyclical nature of the real estate and construction industry, coupled with intense competition, means that sustaining this growth and profitability requires continuous innovation, efficient cost management, and strong brand recall.
Key Financial Metrics
Metric | FY23 | FY24 | FY25 | FY26 | Latest TTM |
|---|---|---|---|---|---|
| Revenue (Rs crore) | 4,382.00 | 4,549.00 (Est.) | 4,677.81 | 4,883.22 | 4,883.22 |
| PAT (Rs crore) | 345.00 | 295.00 (Est.) | 300.02 | 487.00 | 487.00 |
| EBITDA Margin (%) | 13.51 | 13.00 (Est.) | 12.00 (Est.) | 19.19 (Q4) | ~16.00 (Est. FY26) |
| ROCE (%) | 27.91 | 12.78 | 17.54 | 12.65 | 23.30 |
| Debt/Equity (x) | 0.09 | 0.10 | 0.09 | 0.10 | 0.10 |
Kajaria Ceramics has demonstrated consistent revenue growth over the past few fiscal years, with FY26 seeing a noticeable uptick in both revenue and profit after tax (PAT). The estimated FY24 revenue is based on FY25 growth rates, as explicit full-year consolidated figures were not consistently available across all sources for FY24. The significant jump in PAT in FY26 (62.32% YoY) is a key highlight, partially driven by strong Q4 FY26 performance where PAT surged over 260%. This profit growth, however, must be viewed in context of the previous year's performance and the cyclical nature of the industry.
EBITDA margins, particularly the reported 19.19% for Q4 FY26, indicate improved operational efficiency and possibly benefits from the shift from unorganised to organised players. However, the full-year FY26 EBITDA margin would likely be lower than the Q4 peak, given earlier quarters. Return on Capital Employed (ROCE) has shown some fluctuation, with a latest TTM figure of 23.30% suggesting efficient capital utilization, but the FY26 figure is lower. The company maintains a healthy balance sheet with a low Debt-to-Equity ratio, indicating prudent financial management and limited leverage risk. This financial strength provides resilience against industry downturns and supports future growth initiatives.
What the Market Is Missing
The market, often fixated on headline growth and capital allocation events like buybacks, might be overlooking the nuanced and potentially fragile assumptions underpinning Kajaria Ceramics' long-term value. While the recent buyback signals management's confidence and could be accretive to EPS, it doesn't fundamentally alter the industry's cyclicality or the intensity of competition. Investors may be assuming a sustained, linear shift from unorganised to organised players, driven by regulatory changes and rising input costs for smaller players. However, this shift is not irreversible. A moderation in gas prices or changes in regulatory enforcement could allow unorganised players to regain competitiveness, putting pressure on Kajaria's pricing power and margins.
Furthermore, the market might be underestimating the impact of real estate cycles. While India's housing demand appears robust, any significant slowdown in new construction or renovation activity could directly hit tile demand. Kajaria's strong brand and distribution network are advantages, but they don't make it immune to broader economic headwinds. The company's expansion into bathware and adhesives is a positive diversification, but these segments are also competitive and require sustained investment to scale meaningfully and achieve similar profitability to its core tile business. The capital expenditure plans, while necessary for growth, will also tie up capital and need to deliver commensurate returns to justify the investment.
Another overlooked aspect could be the potential for overcapacity in the organised sector itself. As larger players expand, the industry could face periods of intense price competition, eroding the very margins that have recently seen an uplift. The market also tends to extrapolate recent margin expansion without fully discounting the potential for raw material and energy cost volatility, which remains a perennial risk in the manufacturing sector. The optimism surrounding market share gains might be prematurely pricing in a permanent structural advantage, rather than a transient benefit that requires constant vigilance and adaptation.
Valuation and Expectations
Metric | Kajaria Ceramics (LTM/FY26) | Cera Sanitaryware (TTM) | Somany Ceramics (TTM) |
|---|---|---|---|
| Market Cap (Rs crore) | 19,059 | 8,165 | 2,106 |
| P/E (x) | 34.9 | 40.26 | 25.96 |
| P/B (x) | 6.15 | 5.55 | 2.31 |
| EV/EBITDA (x) | 19.4 | N/A | N/A |
| ROCE (%) | 23.3 | 19.3 | 10.5 |
Kajaria Ceramics currently trades at a P/E multiple of approximately 34.9x (LTM) and an EV/EBITDA of 19.4x (LTM). When compared to peers like Cera Sanitaryware (P/E ~40x) and Somany Ceramics (P/E ~26x), Kajaria appears to be valued at a premium to Somany but slightly below Cera on a P/E basis. The higher ROCE for Kajaria (23.3%) compared to Cera (19.3%) and Somany (10.5%) suggests superior capital efficiency, which justifies some of its premium valuation.
The current valuation seems to price in continued market share gains from the unorganised sector, sustained demand growth from real estate and renovation, and stable-to-improving margins. A P/E of 34.9x implies expectations of healthy earnings growth for the foreseeable future, likely in the mid-to-high teens. Any deceleration in volume growth, inability to pass on input cost increases, or a re-emergence of competitive pressures could lead to a re-rating of these multiples. Investors are essentially paying for a scenario where Kajaria continues to consolidate its leadership and expand its profitability, potentially underestimating the inherent volatility and competitive dynamics of the building materials industry. The buyback at a premium could be seen as a way to support the stock price, but its long-term impact on valuation depends on the underlying business performance justifying this capital allocation.
Bull, Base, and Bear Scenarios
Scenario | Key Assumptions | Impact on Growth & Margins | Implied Valuation Range (P/E) |
|---|---|---|---|
| Bull Case | Rapid acceleration of housing demand, sustained market share shift from unorganised players, stable input costs, successful diversification into bathware/adhesives. | Revenue growth >15% annually, EBITDA margins expand to 20%+, ROCE >25%. | 40x - 45x |
| Base Case | Moderate housing demand (7-10% growth), gradual organised market share gains, some input cost volatility managed through pricing, steady performance in new segments. | Revenue growth 10-12% annually, EBITDA margins 16-18%, ROCE 18-22%. | 30x - 35x |
| Bear Case | Significant slowdown in real estate, intense price competition from resurgent unorganised sector or aggressive organised players, sharp rise in gas/raw material costs, execution challenges in new segments. | Revenue growth <5% annually, EBITDA margins contract to <15%, ROCE <15%. | 20x - 25x |
The bull case assumes a 'perfect storm' for Kajaria, where favourable macroeconomic conditions in India combine with its strategic advantages to deliver exceptional growth and profitability. This scenario would likely see the stock trade at a higher multiple, reflecting sustained earnings momentum. The base case represents a more realistic outlook, factoring in the inherent cyclicality and competitive pressures, but still acknowledging Kajaria's strong positioning. Under this scenario, the current valuation seems largely priced in. The bear case highlights the significant downside risks, particularly from a sharp reversal in demand or a failure to maintain pricing power against competitors and rising input costs. This could lead to a substantial de-rating of the stock. Investors should consider the probability weighting of these scenarios, noting that the building materials sector rarely experiences prolonged periods of uninterrupted high growth and margin expansion. The current market narrative appears to lean towards the optimistic side, suggesting that the downside risks might be insufficiently factored into the current share price.
Key Risks and Thesis Breakers
Peer Comparison
Company | Market Cap (Rs crore) | Latest Price (Rs) | P/E (x) | P/B (x) | ROCE (%) |
|---|---|---|---|---|---|
| Kajaria Ceramics | 19,059 | 1,196.60 | 34.9 | 6.15 | 23.3 |
| Cera Sanitaryware | 8,165 | 6,330.00 | 40.26 | 5.55 | 19.3 |
| Somany Ceramics | 2,106 | 513.95 | 25.96 | 2.31 | 10.5 |
Kajaria Ceramics, with the largest market capitalization among the selected peers, commands a significant leadership position in the Indian tile industry. Its P/E multiple of 34.9x (LTM) positions it between Cera Sanitaryware (higher P/E of 40.26x) and Somany Ceramics (lower P/E of 25.96x). The key differentiator for Kajaria is its superior Return on Capital Employed (ROCE) of 23.3%, which is notably higher than Cera (19.3%) and significantly above Somany (10.5%). This higher capital efficiency, coupled with its dominant market share and extensive distribution, justifies its premium valuation over Somany.
While Cera Sanitaryware trades at a slightly higher P/E, its business mix is more focused on sanitaryware and bath fittings, which can have different growth and margin dynamics. Kajaria's scale and diversified manufacturing base, including its hub-and-spoke model, provide it with competitive advantages in terms of cost control and market reach. The ability to generate higher returns on capital suggests better operational execution and pricing power within its core tile segment. However, the market's willingness to pay a premium for Cera might reflect higher perceived growth opportunities or stability in its specific product categories. For Kajaria, sustaining its ROCE and demonstrating profitable growth in new segments will be crucial to maintain or expand its valuation relative to peers.
Who Should and Should Not Consider This Stock
Suitable For
- Long-term investors seeking exposure to India's organised building materials sector with a strong market leader.
- Investors comfortable with cyclical industries but valuing companies with robust balance sheets and proven execution capabilities.
- Growth-at-a-reasonable-price (GARP) investors who believe in the continued formalization of the Indian economy and market share shifts towards organised players.
Not Suitable For
- Short-term traders or investors seeking quick gains based on news events like buybacks.
- Investors highly sensitive to macroeconomic cycles, particularly those related to real estate and construction.
- Value investors seeking deeply undervalued assets, as the current valuation already prices in significant growth and market leadership.
What to Track Going Forward
Final Take
Kajaria Ceramics stands as a formidable player in the Indian tile industry, leveraging its scale, brand, and distribution to capture market share from the fragmented unorganised sector. The recent Q4 FY26 results, showcasing robust profit growth, and the announcement of a share buyback, undoubtedly highlight the company's strong financial health and management's confidence. However, for a discerning long-term investor, the narrative extends beyond these immediate positives. The core thesis that Kajaria can sustain its premium valuation rests on the continued formalization of the industry, enduring demand from construction and renovation, and its ability to maintain pricing power against both unorganised and organised competition.
Uncertainty primarily stems from the cyclical nature of the real estate sector and the inherent volatility of input costs like natural gas. While the company has demonstrated resilience and operational efficiency, any significant macroeconomic headwinds or a reversal in raw material price trends could challenge its margin expansion. The buyback, while potentially accretive to EPS, requires scrutiny as a capital allocation strategy; its long-term value creation depends on whether it truly reflects undervaluation or a temporary pause in high-return investment opportunities. Investors should therefore focus less on short-term news and more on the consistent delivery of volume growth, stable-to-improving margins, and efficient capital deployment in its core and diversified segments. Monitoring these fundamental drivers will be key to determining if Kajaria Ceramics can continue to justify its premium in the dynamic Indian building materials landscape.
Frequently Asked Questions
What does Kajaria Ceramics' recent share buyback imply about its future growth prospects?
A share buyback can imply management believes its stock is undervalued, or it might signal a lack of high-return capital expenditure opportunities. For Kajaria, while it reflects confidence in financial strength, investors should assess if the buyback is a one-off event or part of a broader capital allocation strategy, and whether it truly enhances long-term value in a cyclical industry.
How sustainable are Kajaria's recent profit margins, and what risks could impact them going forward?
Kajaria's Q4 FY26 saw a significant margin expansion, partly due to cost optimization and benefits from disruption in the unorganised sector. However, sustainability depends on stable raw material and gas prices, continued market share gains from unorganised players, and the company's ability to maintain pricing power amidst competition. Any resurgence of unorganised players or adverse shifts in input costs could pressure these margins.
References
- [1] Kajaria Ceramics Ltd share price - Screener - Screener. View Source ↗(Accessed: 2026-06-26)
- [2] Kajaria Ceramic Share Price - The Economic Times - The Economic Times - Indiatimes. View Source ↗(Accessed: 2026-06-26)
- [3] Kajaria Ceramics Q4 Results FY26: Profit Jumps 260%, ₹297 Cr Buyback, ₹6 Dividend Announced - Sahi - Sahi. View Source ↗(Accessed: 2026-06-26)
- [4] Kajaria Ceramics Q4 FY26 Results: PAT as per NSE/BSE exchange filing - Univest - Univest. View Source ↗(Accessed: 2026-06-26)
- [5] Kajaria Ceramics (KAJARIACER.NS) - Market capitalization - Companies Market Cap - Companies Market Cap. View Source ↗(Accessed: 2026-06-26)
- [6] Cera Sanitaryware Ltd share price | About Cera Sanitary. | Key Insights - Screener - Screener. View Source ↗(Accessed: 2026-06-26)
- [7] Somany Ceramics Share Price - The Economic Times - Indiatimes - The Economic Times - Indiatimes. View Source ↗(Accessed: 2026-06-26)
- [9] KAJARIA CERAMICS Price/Earnings(PE) Ratio-19 Jun,2026 - Smart-Investing.in - Smart-Investing.in. View Source ↗(Accessed: 2026-06-26)
- [10] About Kajaria Ceramics - Company Information, Overview, History and Profile - Invest Yadnya. View Source ↗(Accessed: 2026-06-26)
- [13] Kajaria Ceramics Ltd (500233) P/E Ratio - Investing.com IN - Investing.com IN. View Source ↗(Accessed: 2026-06-26)
- [16] Kajaria Ceramics Q4 FY26 Revenue Rises 12% to ₹1,373 Crores, PAT Triples YoY - ScanX - ScanX. View Source ↗(Accessed: 2026-06-26)
- [17] Kajaria Ceramics Ltd Key Financial Ratios & Metrics - Pocketful - Pocketful. View Source ↗(Accessed: 2026-06-26)
- [18] Cera Sanitary Share Price Today, Cera Sanitary Stock Price Live NSE/BSE Updates | The Economic Times - The Economic Times - Indiatimes. View Source ↗(Accessed: 2026-06-26)
- [19] PE analysis of Kajaria Ceramics Ltd., FY Ratio 30.19 - Top Stock Research - Top Stock Research. View Source ↗(Accessed: 2026-06-26)
- [20] Kajaria Ceramics Q4 FY26 Results - Innovacia Insights - Innovacia Insights. View Source ↗(Accessed: 2026-06-26)
- [25] KAJARIACER.NS EV/EBITDA - ValueInvesting.io - ValueInvesting.io. View Source ↗(Accessed: 2026-06-26)
- [26] KAJARIA CERAMICS LIMITED Investor Update | Q4 FY26 - Kajaria Ceramics Investor Presentation. View Source ↗(Accessed: 2026-06-26)
- [27] Kajaria Ceramics' net profit rises 62.32% in FY26; approves ₹297 crore share buyback - ET Realty - ET Realty. View Source ↗(Accessed: 2026-06-26)
- [29] Kajaria Ceramics Ltd. Share Price Today, Market Cap, Price Chart, Balance Sheet - Tickertape. View Source ↗(Accessed: 2026-06-26)
- [30] Kajaria Ceramics Ltd (500233) EV/EBITDA - Investing.com IN - Investing.com IN. View Source ↗(Accessed: 2026-06-26)
- [31] EV to EBITDA analysis of Kajaria Ceramics Ltd., FY Ratio 16.08 - Top Stock Research - Top Stock Research. View Source ↗(Accessed: 2026-06-26)
- [38] Somany Ceramics Ltd share price - Screener - Screener. View Source ↗(Accessed: 2026-06-26)
- [43] Kajaria Ceramics: The Biggest Winner Of India's Tile Industry Shift? - YouTube - STOCK MARKET ANALYSIS WITH SANDEEP. View Source ↗(Accessed: 2026-06-26)
- [44] About Kajaria Ceramics |India's No.1 Tile Company - Kajaria Ceramics official website. View Source ↗(Accessed: 2026-06-26)
- [46] The future is exciting. - Kajaria - Kajaria Ceramics Annual Report/Investor Presentation (2023). View Source ↗(Accessed: 2026-06-26)
Disclaimer: IMPORTANT DISCLAIMER: This analysis is generated using artificial intelligence and is NOT a recommendation to purchase, sell, or hold any stock. This analysis is for informational and educational purposes only. Past performance does not guarantee future results. Please consult with a qualified financial advisor before making any investment decisions. The author and platform are not responsible for any investment losses.
Continue Your Investment Journey
Discover more insights that match your interests

India's SaaS Unicorns: The Next Infosys Generation?
Explore India's booming SaaS sector with analysis of Freshworks, Zoho, Chargebee, and emerging unicorns. Can Indian SaaS companies replicate Infosys's global success?
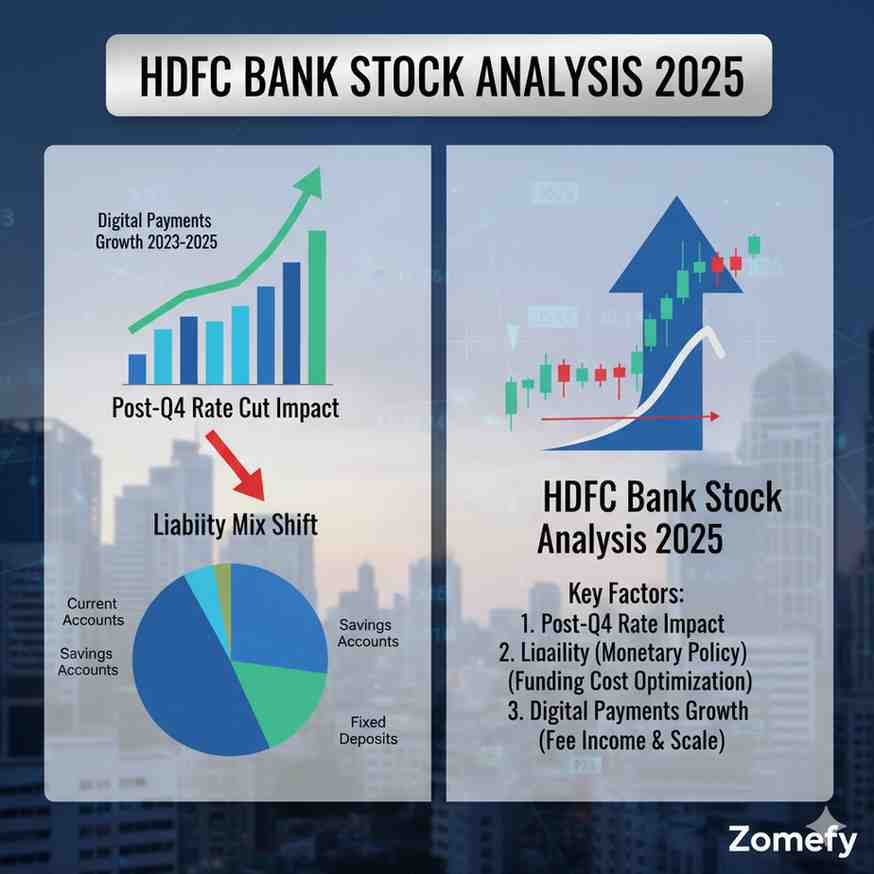
HDFC Bank Stock Analysis 2025: Post-Q4 Rate Cut Impact, Liability Mix Shift & Digital Payments Growth
HDFC Bank, India's largest private sector bank by market capitalization at ₹15.
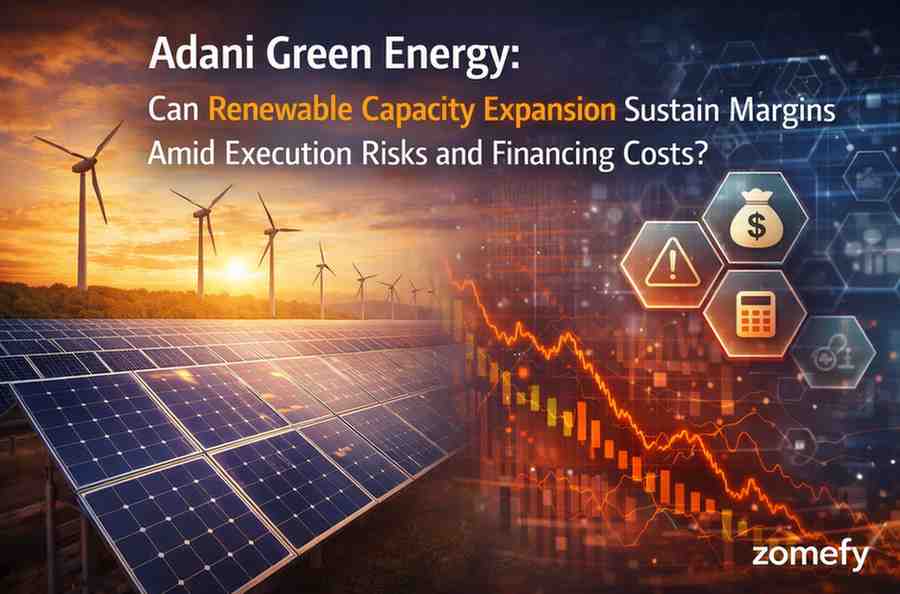
Adani Green Energy: Can Renewable Capacity Expansion Sustain Margins Amid Execution Risks and Financing Costs?
Adani Green Energy (AGEL), India's largest pure-play renewable energy company, commands a massive market presence with over 17 GW operational capacity, riding the nation's push towards 500 GW non-f...

Metropolis Healthcare: Can Strategic Bonus Issue Drive Long-Term Shareholder Value Amidst Sector
Metropolis Healthcare, a prominent name in India's diagnostics sector, recently announced a 3:1 bonus issue, a corporate action often perceived positively by the market as it signals a company's fi...
Explore More Insights
Continue your financial education journey