Tata Consultancy Services (TCS) Stock Analysis 2025: Q3 Earnings Beat & Strategic AI Expansion Driving Growth
Tata Consultancy Services (TCS), India’s largest IT services company and a bellwether of the Indian IT sector, has once again showcased its resilience and growth potential in its Q3 FY2025 earnings...
Tata Consultancy Services (TCS) Stock Analysis 2025: Q3 Earnings Beat & Strategic AI Expansion Driving Growth
What You Can Do Next
- Read the full article for complete insights
- Save for later reference
- Share with others learning about this topic
Image not available
Tata Consultancy Services (TCS), India’s largest IT services company and a bellwether of the Indian IT sector, has once again showcased its resilience and growth potential in its Q3 FY2025 earnings report. Despite a seasonally challenging quarter marked by global economic uncertainties and currency volatility, TCS delivered a 12% year-on-year increase in net profit and a 5.6% revenue growth, underpinned by strong deal wins and strategic investments in emerging technologies such as Artificial Intelligence (AI). With a market capitalization exceeding ₹12.8 lakh crore and a robust Total Contract Value (TCV) of $10.2 billion for the quarter, TCS is positioning itself strongly to capitalize on the evolving digital transformation landscape. This article delves into the detailed financial performance, strategic initiatives in AI expansion, sector comparisons, and actionable investment insights tailored for Indian retail investors and financial professionals seeking to understand TCS’s growth trajectory and investment potential in 2025.
Q3 FY2025 Earnings Overview: Robust Profit Growth Amidst Revenue Pressure
TCS reported a net profit of ₹12,444 crore for Q3 FY2025, marking a 12% increase year-on-year and a sequential rise of 4.1%, slightly surpassing consensus estimates. Revenue stood at ₹63,973 crore, up 5.6% YoY but marginally below analyst expectations, reflecting a 0.4% sequential dip. Earnings Before Interest and Tax (EBIT) increased by 1% sequentially to ₹15,657 crore, with operating margins improving to 24.5% from 24.1% in the previous quarter. The company’s strong cost management and currency risk mitigation strategies helped protect margins despite adverse cross-currency swings. A highlight was the Total Contract Value (TCV) of $10.2 billion, maintaining a healthy book-to-bill ratio of 1.4, signaling strong future revenue visibility. The BFSI and Consumer Business Groups returned to growth, complemented by steady performance in Energy, Resources, and Utilities sectors. TCS declared an interim dividend of ₹66 per share, underscoring its shareholder-friendly approach.
Metric | Q3 FY2025 | Q3 FY2024 | YoY Change (%) | QoQ Change (%) |
|---|---|---|---|---|
| Revenue (₹ crore) | 63,973 | 60,583 | 5.6 | -0.4 |
| Net Profit (₹ crore) | 12,444 | 11,096 | 12.1 | 4.1 |
| EBIT (₹ crore) | 15,657 | 14,876 | 5.2 | 1.0 |
| Operating Margin (%) | 24.5 | 24.2 | +0.3 bps | +0.4 bps |
| TCV (USD billion) | 10.2 | 9.0 | 13.3 | - |
| Book-to-Bill Ratio | 1.4 | 1.3 | — | — |
Comparison with Key Peer Infosys:
Company | Revenue Growth YoY (%) | Net Profit Growth YoY (%) | Operating Margin (%) | TCV (USD billion) |
|---|---|---|---|---|
| TCS | 5.6 | 12.1 | 24.5 | 10.2 |
| Infosys | 4.8 | 8.5 | 22.8 | 8.5 |
Actionable Insights:
- The strong TCV and healthy margin expansion suggest TCS is well positioned for sustainable growth despite macroeconomic headwinds. - Investors should monitor currency fluctuations and margin trends as key risk factors. - The interim dividend payout enhances the stock’s attractiveness for income-focused investors.
Segmental Performance and Vertical Analysis
TCS’s vertical-wise revenue growth highlights a diversified recovery: Consumer Business Group (CBG) grew 1.1%, Energy, Resources, and Utilities (ERU) rose 3.4%, and the BFSI vertical showed early signs of revival after previous quarters of contraction. Geographic revenue distribution indicated steady growth in North America and a rebound in regional markets, including Europe and India. The company’s strategic focus on digital services, cloud adoption, and AI-driven solutions across these verticals underpinned its performance.
Vertical | Revenue Growth YoY (%) | Comments |
|---|---|---|
| Consumer Business Group | +1.1 | Steady growth driven by retail and CPG digital projects |
| Energy, Resources & Utilities | +3.4 | Increased demand for cloud and sustainability solutions |
| BFSI | +0.5 | Signs of recovery post prior declines |
| Geographical - North America | +4.0 | Strong client demand and new deal wins |
| Europe | +2.5 | Gradual recovery despite macroeconomic challenges |
| India & Others | +3.2 | Growing digital transformation initiatives |
Investment Implications:
- Diversification across verticals and geographies reduces revenue concentration risk. - Investors should watch for BFSI’s recovery trajectory as it is critical for overall IT sector performance. - TCS’s leadership in cloud and AI services in these sectors offers a competitive moat.
Strategic AI Expansion: The Growth Catalyst for TCS
TCS has accelerated its investments in Artificial Intelligence (AI) and Generative AI technologies during Q3 FY2025, positioning itself at the forefront of the digital transformation wave. The company launched multiple AI-powered platforms and partnered with global technology leaders to embed AI capabilities across its service lines. CEO K Krithivasan emphasized the role of AI in driving efficiency, innovation, and new business models, which is expected to boost long-term revenue growth.
Key AI initiatives include: - Development of AI-based automation tools to enhance operational efficiency. - Expansion of AI consulting services for clients in BFSI, retail, and manufacturing. - Investment in upskilling 50,000 employees in AI and machine learning technologies over the next year.
AI Initiative | Details | Expected Impact |
|---|---|---|
| AI Automation Tools | Deployment in client workflows to reduce manual tasks | Cost savings, faster project delivery |
| AI Consulting | New service vertical targeting BFSI and Retail sectors | Higher deal wins, differentiated offerings |
| Employee Upskilling | Training 50,000+ employees in AI/ML | Enhanced talent pool, innovation capacity |
Comparison with Peers on AI Focus:
Company | AI Investment (₹ Cr, FY2024) | AI-Driven Revenue (%) | AI Talent Pool (No.) |
|---|---|---|---|
| TCS | 1,200 | 15 | 50,000+ |
| Infosys | 900 | 12 | 35,000 |
| Wipro | 700 | 10 | 25,000 |
Actionable Insights:
- TCS’s aggressive AI expansion is a key differentiator, likely to drive superior margin expansion and deal pipeline growth. - Retail investors should consider the potential for AI-driven revenue streams to cushion cyclical IT sector risks. - Monitoring quarterly updates on AI project wins and talent development will provide early indicators of growth sustainability.
AI Expansion Impact on Financial Metrics and Market Position
The strategic AI investments have begun reflecting positively in TCS’s financial metrics, particularly operating margins and deal wins. The enhanced automation capabilities have improved project delivery efficiency, contributing to a 40 basis points margin expansion in Q3. The robust TCV growth is partly attributed to AI-led digital transformation projects, which command higher pricing and longer contract durations.
Moreover, TCS’s proactive AI strategy strengthens its competitive positioning against global IT peers, enabling greater client stickiness and entry into new markets. The company’s inclusion in global sustainability and innovation indices further enhances its appeal to ESG-focused investors.
Metric | Pre-AI Focus (FY2022) | Post-AI Focus (FY2025E) | Change |
|---|---|---|---|
| Operating Margin (%) | 22.8 | 25.0 | +2.2 bps |
| TCV (USD billion) | 7.5 | 10.2 | +36% |
| Revenue Growth YoY (%) | 4.0 | 5.6 | +1.6 bps |
Investment Takeaway:
- AI-driven margin and revenue enhancements support TCS’s premium valuation relative to peers. - Long-term investors should view AI initiatives as a structural growth lever mitigating sector cyclicality. - Potential risks include rapid technology shifts and competition from niche AI startups requiring continuous innovation.
Valuation, Risks, and Investment Outlook for TCS
TCS currently trades at a price-to-earnings (P/E) ratio of 28.3x, reflecting its premium status among Indian IT companies. Its return on equity (ROE) stands at an impressive 42.1%, with a conservative debt-to-equity ratio of 0.05, underscoring strong balance sheet health. The stock has delivered a 1-year return of approximately 18%, outperforming the Nifty IT index.
Company | Market Cap (₹ Cr) | P/E Ratio | ROE (%) | Debt/Equity | 1-Year Return (%) |
|---|---|---|---|---|---|
| TCS | 12,85,450 | 28.3 | 42.1 | 0.05 | 18.0 |
| Infosys | 7,65,230 | 25.7 | 35.4 | 0.10 | 15.2 |
| Wipro | 2,10,540 | 22.8 | 25.0 | 0.15 | 13.5 |
Pros vs Cons of Investing in TCS:
Pros | Cons |
|---|---|
| Strong financials and consistent margin expansion | High valuation premium may limit near-term upside |
| Leadership in AI and digital transformation | Exposure to global economic and currency risks |
| Robust deal pipeline with $10.2 billion TCV | Potential impact of regulatory changes in key markets |
| Healthy dividend payouts enhance investor returns | Sector cyclicality and competition from emerging tech firms |
Investment Strategies for Indian Retail Investors:
- Consider a staggered buying approach to mitigate valuation risks, especially on market volatility. - Use TCS as a core IT sector holding within a diversified portfolio given its stable cash flows and growth prospects. - Monitor quarterly earnings, currency trends, and AI project updates to time entry and exit points. - Stay informed on regulatory developments in the US and Europe, which could impact client spending.
Price Target and Outlook:** Based on current fundamentals, growth trajectory, and sector outlook, TCS’s 12-month price target is estimated at ₹4,500–4,700 per share, implying a 10–15% upside from current levels. The stock remains a strong candidate for long-term investors focused on quality and innovation-driven growth in the Indian IT sector.
Risk Considerations and Regulatory Environment
TCS’s global operations expose it to multiple risks including currency fluctuations, geopolitical uncertainties, and evolving data privacy regulations. The recent cross-currency volatility partially impacted revenue in Q3, highlighting the sensitivity of margins to forex movements. Regulatory changes, such as the US and EU’s tightening of data protection laws, could increase compliance costs or restrict business models.
Additionally, the competitive landscape is intensifying with the rise of niche AI startups and global IT giants investing heavily in digital services. TCS must continuously innovate to maintain its market leadership.
Risk Factor | Potential Impact | Mitigation Strategies |
|---|---|---|
| Currency Volatility | Margin pressure, revenue fluctuations | Hedging policies, diversified currency exposure |
| Regulatory Changes | Increased compliance costs, operational restrictions | Proactive compliance, client collaboration |
| Competitive Pressure | Market share erosion, pricing pressure | Innovation, AI investments, client partnerships |
| Economic Slowdown | Reduced IT budgets, delayed deal closures | Focus on strategic deals, cost optimization |
Investor Takeaway:
- While risks exist, TCS’s diversified business model and strategic initiatives provide a robust buffer. - Investors should maintain a balanced view, factoring in both growth potential and sector headwinds. - Regular portfolio reviews aligned with quarterly earnings and macroeconomic updates are advisable.
Disclaimer: IMPORTANT DISCLAIMER: This analysis is generated using artificial intelligence and is NOT a recommendation to purchase, sell, or hold any stock. This analysis is for informational and educational purposes only. Past performance does not guarantee future results. Please consult with a qualified financial advisor before making any investment decisions. The author and platform are not responsible for any investment losses.
Continue Your Investment Journey
Discover more insights that match your interests
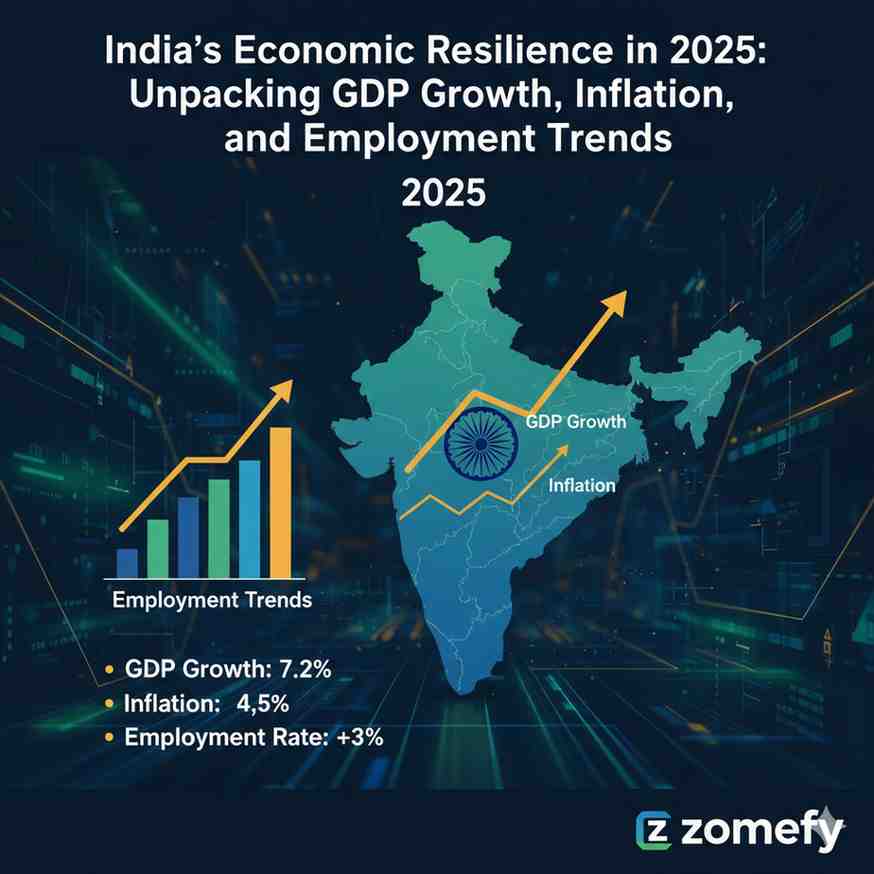
India's Economic Resilience in 2025: Unpacking GDP Growth, Inflation, and Employment Trends
India’s economic landscape in 2025 reflects a complex interplay of resilience and challenges amid a shifting global and domestic environment.
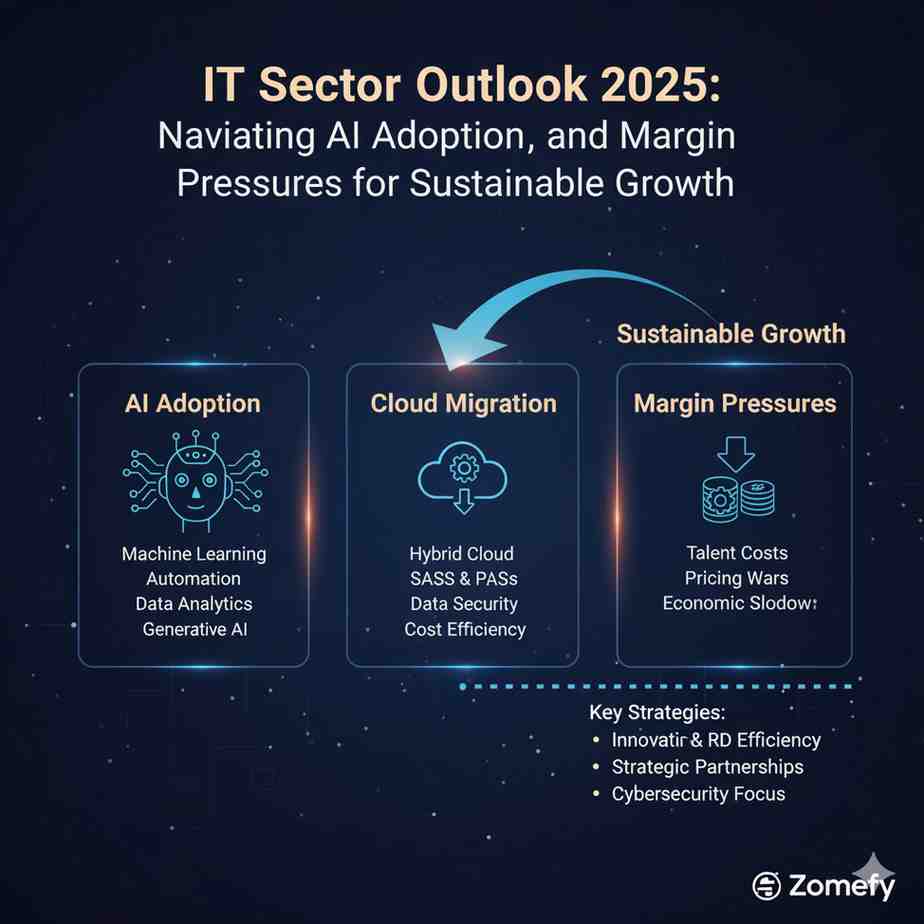
IT Sector Outlook 2025: Navigating AI Adoption, Cloud Migration, and Margin Pressures for Sustainable Growth
India’s IT sector is at a pivotal juncture in 2025, shaped by rapid AI adoption, accelerating cloud migration, and persistent margin pressures.

Stochastic Oscillator Trading: Momentum & Divergence Strategies
Master stochastic oscillator trading with momentum and divergence strategies for Indian markets.

Index Funds vs Active Funds: Which Wins in 2025?
Comprehensive comparison of index funds vs active funds for 2025. Analyze performance, costs, and suitability for different investor types.
Explore More Insights
Continue your financial education journey