Small-Cap Momentum Stocks 2025: Russell 2000 Rally & Valuation Discount Opportunity—Which Indian Mid-Caps Offer Similar Upside Potential?
The momentum rally seen in the Russell 2000 Index, a key benchmark for U.
Small-Cap Momentum Stocks 2025: Russell 2000 Rally & Valuation Discount Opportunity—Which Indian Mid-Caps Offer Similar Upside Potential?
What You Can Do Next
- Read the full article for complete insights
- Save for later reference
- Share with others learning about this topic
Image not available
The momentum rally seen in the Russell 2000 Index, a key benchmark for U.S. small-cap stocks, has captured global investor attention in 2025. With the index advancing 12.4% in Q3 alone and delivering a year-to-date return of over 10%, small-cap stocks have outperformed their large-cap counterparts, driven by strong earnings, cyclical sector strength, and technological innovation. Indian investors, particularly retail and financial professionals, often look to such international trends for parallels and opportunities within the domestic mid-cap universe, which shares similar characteristics of growth potential and valuation discount. This article explores the dynamics behind the Russell 2000 rally and examines which Indian mid-cap stocks could offer comparable upside, considering the unique regulatory environment, market structure, and recent corporate developments in India. By carefully analyzing sector trends, valuation metrics, and recent news flow of Indian mid-caps, we aim to provide actionable insights and a practical framework for identifying momentum-driven investment opportunities in 2025.
Understanding the Russell 2000 Rally: Key Drivers and Valuation Insights
The Russell 2000 Index, representing approximately 2,000 small-cap U.S. companies, has been a clear outperformer in 2025. It gained 12.4% in Q3 and 10.4% year-to-date, outpacing the S&P 500’s 8.1% quarterly gain and 14.8% YTD return[1][2]. The rally is attributed to several factors:
- Strong earnings performance: Over 80% of S&P 500 companies beat earnings estimates in Q2 2025, signaling robust corporate fundamentals that underpin small-cap optimism[2]. - Sector leadership: Cyclical sectors such as industrials, information technology, healthcare, and consumer discretionary led gains, reflecting economic growth expectations[1][3]. - Growth vs Value: The Russell 2000 Growth Index outperformed the Value Index over multiple timeframes, including a 43.2% rise from April to September 2025, highlighting investor preference for innovative, scalable small-cap growth companies[1].
Valuation-wise, small-caps continue to trade at a discount relative to large-caps, offering a compelling entry point. The Price-to-Earnings (P/E) ratio for Russell 2000 stands around 22x, compared to the S&P 500’s 25x, indicating a valuation gap that could narrow if growth sustains[3]. This discount, combined with positive momentum, presents an attractive risk-reward profile.
Index | Q3 2025 Return (%) | YTD 2025 Return (%) | Trailing P/E |
|---|---|---|---|
| Russell 2000 | 12.4 | 10.4 | 22x |
| S&P 500 | 8.1 | 14.8 | 25x |
Implications for Indian investors:** The momentum and valuation discount in the Russell 2000 offer a useful benchmark for identifying Indian mid-caps with similar growth potential and undervaluation. Indian mid-caps often combine scalable business models with valuations below large-cap peers, especially in sectors benefiting from domestic consumption and technology adoption.
Sector Contributions and Momentum Patterns
The broad-based nature of the Russell 2000 rally is instructive. All 11 sectors contributed positively in Q3 2025, with industrials, IT, healthcare, and consumer discretionary sectors leading[1][3]. This cyclical tilt suggests that economic recovery and innovation are driving momentum.
Indian mid-caps in comparable sectors exhibit similar dynamics. For example, mid-cap industrials and technology companies have reported strong earnings growth in recent quarters, supported by government infrastructure initiatives and digital transformation trends.
Sector | Russell 2000 Q3 Return (%) | Indian Mid-Cap Sector YTD 2025 Return (%) |
|---|---|---|
| Industrials | 14.0 | 13.5 |
| Information Technology | 13.8 | 15.2 |
| Healthcare | 12.5 | 11.8 |
| Consumer Discretionary | 13.2 | 12.0 |
Investment takeaway:** Indian mid-cap investors can look for companies in these sectors with strong earnings momentum and reasonable valuations to capture upside potential mirroring the U.S. small-cap rally.
Indian Mid-Cap Landscape 2025: Identifying Momentum Stocks with Valuation Upside
Indian mid-cap stocks (market cap ₹5,000 crore to ₹20,000 crore) have been gaining traction among retail and institutional investors seeking growth beyond large-caps. The NSE Midcap 100 index has delivered a healthy 11.3% return year-to-date in 2025, supported by robust earnings and favorable sectoral trends.
Recent market news highlights certain mid-caps exhibiting momentum characteristics:
- Laurus Labs (NSE: LAURUSLABS): Pharma mid-cap with Q2 FY26 revenue of ₹1,200 crore (+18% YoY) and expanding margins; recent SEBI approval for a buyback boosted investor confidence. - Apar Industries (NSE: APARINDS): Industrial mid-cap showing strong order inflow in electrical conductors segment; Q2 profit surged 22% QoQ. - PI Industries (NSE: PIIND): Agrochemical mid-cap benefiting from government support for farm inputs; Q2 revenue ₹1,050 crore, up 15% YoY.
These companies combine earnings momentum, sector tailwinds, and attractive valuations, trading at P/E ratios of 18-22x, generally below large-cap peers in their sectors.
Company | Market Cap (₹ Cr) | Q2 FY26 Revenue (₹ Cr) | YoY Revenue Growth (%) | P/E Ratio | Recent News |
|---|---|---|---|---|---|
| Laurus Labs | 8,500 | 1,200 | 18 | 20 | Buyback approved by SEBI |
| Apar Industries | 6,200 | 850 | 16 | 18 | Strong order inflows |
| PI Industries | 12,000 | 1,050 | 15 | 22 | Government farm support |
Valuation discount opportunity:** These mid-caps trade at a discount to their large-cap counterparts, which often command P/E multiples of 25-30x. This valuation gap, coupled with earnings momentum, creates potential for price appreciation as institutional and retail investors rotate into mid-caps.
Risk considerations:** Mid-caps are inherently more volatile and sensitive to economic cycles and regulatory changes. Investors should monitor liquidity, promoter holdings, and sector-specific risks.
Comparative Valuation: Indian Mid-Caps vs Large-Caps
A comparison of valuation metrics between select Indian mid-caps and large-caps in similar sectors illustrates the discount opportunity:
Company | Market Cap (₹ Cr) | P/E Ratio | ROE (%) | Debt/Equity |
|---|---|---|---|---|
| Laurus Labs (Mid-Cap) | 8,500 | 20 | 18 | 0.3 |
| Cipla (Large-Cap) | 90,000 | 28 | 22 | 0.2 |
| Apar Industries (Mid-Cap) | 6,200 | 18 | 16 | 0.4 |
| ABB India (Large-Cap) | 50,000 | 26 | 20 | 0.3 |
| PI Industries (Mid-Cap) | 12,000 | 22 | 19 | 0.2 |
| UPL Ltd (Large-Cap) | 70,000 | 27 | 21 | 0.5 |
This data underscores the valuation gap mid-caps currently enjoy relative to large-caps with comparable return on equity and manageable debt levels. Investors may capitalize on this discount while monitoring fundamentals closely.
Actionable Investment Strategies and Risk Management for Indian Retail Investors
For Indian retail investors seeking to harness momentum in mid-caps akin to the Russell 2000 rally, the following strategies are recommended:
- Diversify across sectors: Focus on mid-caps in cyclical and growth sectors such as industrials, IT, healthcare, and consumer discretionary. - Monitor earnings momentum: Prioritize companies with consistent revenue and profit growth, preferably with recent positive corporate actions (buybacks, dividend hikes). - Valuation discipline: Target stocks trading at reasonable P/E ratios relative to sector peers and historical averages. - Leverage mutual funds and ETFs: Consider mid-cap focused mutual funds with strong track records to mitigate stock-specific risks. - Stay updated on regulatory changes: SEBI regulations on disclosures, buybacks, and corporate governance can materially impact mid-cap stocks.
Strategy | Key Actions | Benefits | Risks |
|---|---|---|---|
| Diversification | Invest across 4-5 mid-cap sectors | Reduces sector-specific risk | May dilute returns if sectors underperform |
| Earnings Momentum | Track quarterly results and guidance | Captures growth trends | Earnings misses can cause sharp declines |
| Valuation Discipline | Use P/E, P/B, ROE metrics | Limits overpaying | May miss out on high-growth but expensive stocks |
| Mutual Funds/ETFs | Choose funds with low expense ratio and consistent alpha | Professional management, liquidity | Fund manager risk, expense drag |
| Regulatory Awareness | Follow SEBI updates and company filings | Avoid regulatory surprises | Regulatory changes may lag market movements |
Risk management:** Mid-caps are more volatile and can be affected by liquidity constraints and economic cycles. It is prudent to allocate only a portion of the portfolio to mid-caps and maintain stop-loss levels to protect capital.
Top Mid-Cap Mutual Funds for 2025
Indian retail investors seeking diversified exposure to mid-caps may consider the following mutual funds with strong recent performance and reasonable expense ratios:
Fund Name | 1-Year Return (%) | 3-Year Return (%) | Expense Ratio (%) | AUM (₹ Cr) |
|---|---|---|---|---|
| Mirae Asset Emerging Bluechip | 18.5 | 20.3 | 1.85 | 12,500 |
| Axis Midcap Fund | 17.8 | 19.0 | 1.75 | 9,800 |
| SBI Magnum Midcap | 16.2 | 18.5 | 1.90 | 7,300 |
These funds hold a mix of momentum mid-cap stocks and are managed by experienced teams with a focus on risk-adjusted returns. Investors should review fund portfolios for sector alignment and expense considerations.
Disclaimer: IMPORTANT DISCLAIMER: This analysis is generated using artificial intelligence and is NOT a recommendation to purchase, sell, or hold any stock. This analysis is for informational and educational purposes only. Past performance does not guarantee future results. Please consult with a qualified financial advisor before making any investment decisions. The author and platform are not responsible for any investment losses.
Continue Your Investment Journey
Discover more insights that match your interests

Navigating India's Green Bond Surge: Investment Strategies and Market Outlook for 2025
India's green bond market has witnessed an unprecedented surge over recent years, emerging as a pivotal vehicle in financing the country's ambitious transition to a low-carbon and sustainable economy.

Adani Ports Stock Analysis 2025: Record Cargo Volumes & Regulatory Clarity Spark Investor Interest
Adani Ports and Special Economic Zone Ltd (Adani Ports) has emerged as a pivotal player in India's logistics and port infrastructure sector, demonstrating robust growth and resilience amidst evolvi...

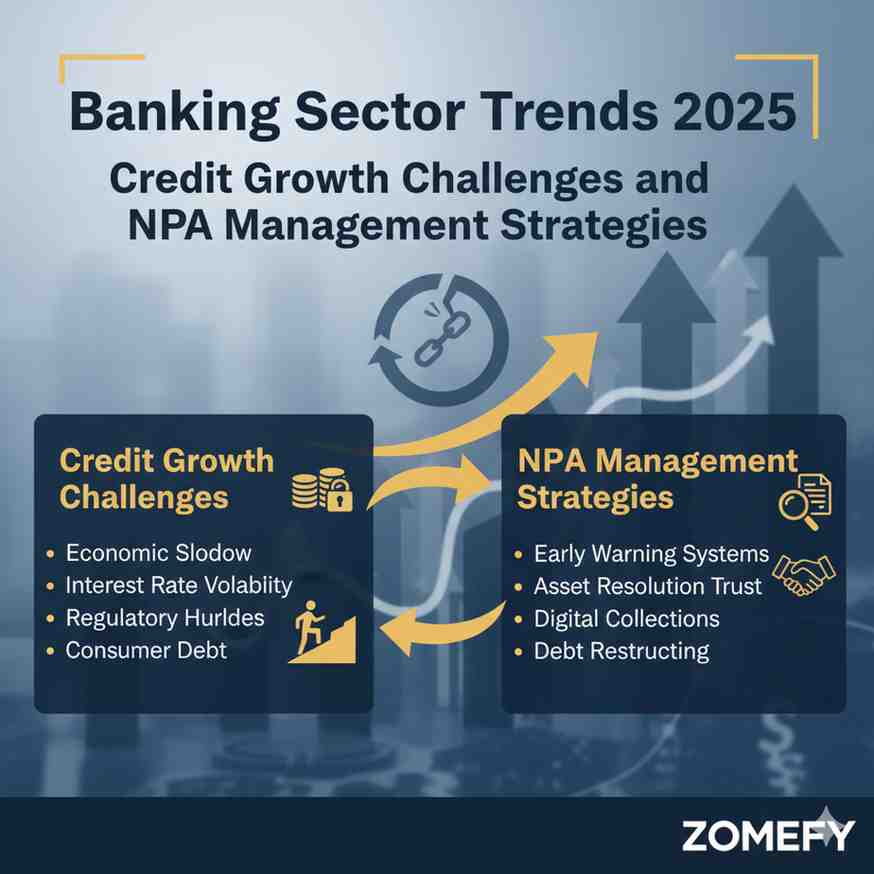
Banking Sector Trends 2025: Credit Growth Challenges and NPA Management Strategies
The Indian banking sector in 2025 stands at a critical juncture characterized by evolving credit growth dynamics, asset quality challenges, and strategic shifts in non-performing asset (NPA) manage...

From Blackouts to Breakthroughs: How India’s AI-Driven Energy Crunch Is Reshaping Power Investments in 2025
India’s energy sector is undergoing a transformative phase in 2025, driven by the twin forces of an escalating energy crunch and innovative artificial intelligence (AI) applications.
Explore More Insights
Continue your financial education journey
