TVS Holdings: Can Dividend Payouts Sustain Shareholder Returns Amidst Evolving Auto Sector
TVS Holdings Ltd (NSE: TVSHLTD), a prominent entity within the diversified TVS Group, has garnered attention as a Core Investment Company (CIC) with.
TVS Holdings: Can Dividend Payouts Sustain Shareholder Returns Amidst Evolving Auto Sector
What You Can Do Next
- Read the full article for complete insights
- Save for later reference
- Share with others learning about this topic
Image not available
TVS Holdings Ltd (NSE: TVSHLTD), a prominent entity within the diversified TVS Group, has garnered attention as a Core Investment Company (CIC) with significant stakes in automotive manufacturing (TVS Motor Company) and financial services (TVS Credit Services). This analysis is triggered by the company's recent interim dividend declaration, which often signals robust financial health and a commitment to shareholder returns. However, for Indian retail investors, understanding the sustainability of such payouts requires looking beyond headline numbers. This article aims to provide a non-consensus perspective on TVS Holdings' business fundamentals, the inherent risks in its diversified portfolio, and the assumptions currently priced into its valuation. We will delve into how the company generates profits, the key drivers of its subsidiary performance, and potential vulnerabilities that could impact long-term shareholder value, thereby equipping investors to make informed decisions amidst an evolving auto sector landscape.
Data Freshness
Updated on: 2026-03-26 As of: 2026-03-25 Latest price: Rs 14,090 (NSE) as of 2026-03-25 Market cap: Rs 28,507 crore Latest earnings period: FY26 Q3 (ended Dec 2025) Key sources: https://www.screener.in/company/TVSHLTD/; https://www.livemint.com/market/stock-market-news/tvs-group-company-declares-an-interim-dividend-of-86-per-share-record-date-other-details-here-11711364585374.html; https://www.business-standard.com/company/tvs-holdings-ltd-quarterly-results-121855/q3-fy25-26-results-summary-226601
News Trigger Summary
Event: TVS Holdings Ltd announced an interim dividend of ₹86 per share (1720% on face value of ₹5) for the financial year 2025-2026 (FY26). The record date for this dividend has been set for April 2, 2026. Date: March 25, 2026 Why the Market Reacted: The declaration of a substantial interim dividend, coupled with the company's strong Q3 FY26 results (consolidated net profit up 27.7% year-on-year to ₹493.16 crore and revenue up 34.5% year-on-year), was perceived positively by the market. This led to a nearly 3% surge in the company's share price on the day of the announcement, reflecting investor confidence in its profitability and commitment to shareholder returns. Why This Is Not Just News: While a dividend announcement is a positive short-term signal, this article goes deeper to assess the long-term sustainability of such payouts and the underlying business health. It evaluates whether the dividend is supported by consistent operational cash flows from its diverse holdings and scrutinizes the risks associated with its primary revenue-generating segments, rather than merely reporting the corporate action. The focus is on the structural integrity of the business model and the evolving competitive landscape, which are critical for evergreen investment analysis.
Core Thesis in One Sentence
TVS Holdings' ability to sustain shareholder returns through dividends is heavily reliant on the consistent, robust performance of its key subsidiaries, TVS Motor Company and TVS Credit Services, amidst increasing competition and cyclical industry dynamics, while managing its elevated debt levels as a Core Investment Company.
Business Model Analysis
TVS Holdings Ltd, formerly known as Sundaram-Clayton Ltd, operates primarily as a Core Investment Company (CIC), a structure that intrinsically links its financial performance to the success of its underlying investments. The company received its CIC license from the RBI in March 2024, signifying its role as a holding entity rather than an operational one for its primary assets. Its most significant asset is a 50.26% stake in TVS Motor Company Ltd, a leading Indian two-wheeler and three-wheeler manufacturer. Therefore, a substantial portion of TVS Holdings' value and dividend-paying capacity is derived from the dividends received from TVS Motor, which in turn depends on the latter's sales volumes, market share, and profitability in the highly competitive Indian and international automotive markets. TVS Motor has also been actively expanding into electric vehicles (EVs), which presents both growth opportunities and significant investment requirements. The 'Automotive vehicles and parts' segment is stated to be the maximum revenue generator for TVS Holdings. Beyond TVS Motor, TVS Holdings also has a notable presence in financial services through TVS Credit Services, a non-banking financial company (NBFC). TVS Credit offers a diversified portfolio of loans, including two-wheeler, used car, tractor, and consumer durable financing. The profitability of TVS Credit is influenced by credit demand, interest rate cycles, and its ability to manage asset quality, particularly in riskier segments like tractors and used commercial vehicles. Historically, TVS Holdings also had a spare parts trading business, which ceased operations from October 2024 as part of the CIC approval process, streamlining its focus towards its core investments. The holding company structure means that TVS Holdings' own operating revenue is relatively small, with its consolidated financial statements reflecting the combined performance of its subsidiaries. The company's ability to generate free cash flow and distribute dividends is thus a function of the cash flows generated by its operating entities and their respective dividend policies. This makes TVS Holdings a proxy play on the broader TVS Group's growth, particularly in mobility and financing, but also exposes it to the specific risks of each underlying business.
Key Financial Metrics
Metric (Rs crore) | FY23 | FY24 | FY25 | Q3 FY26 | TTM (Dec 2025) |
|---|---|---|---|---|---|
| Revenue from Operations | 33,564 | 34,629 | 38,760 | 15,276 | 54,367 |
| Net Profit | 834 | 352 | 352 | 493 | 3,169 |
| ROCE (%) | 13.93 | 16.69 | 17.56 | N/A | 20.5 |
| Debt/Equity (x) | N/A | 6.41 | 5.44 | N/A | 3.16 |
The financial performance of TVS Holdings, as reflected in its consolidated numbers, shows a consistent upward trend in Revenue from Operations, reaching Rs 54,367 crore on a TTM basis as of December 2025. Net Profit, however, shows some variability, with a figure of Rs 352 crore for FY25, but a significantly higher TTM Net Profit of Rs 3,169 crore as of December 2025, largely driven by strong subsidiary performance in the recent quarters. The Return on Capital Employed (ROCE) has shown improvement, moving from 13.93% in FY23 to 17.56% in FY25, and reaching 20.5% on a TTM basis, indicating better capital efficiency. A critical aspect to note is the company's Debt/Equity ratio, which stood at 5.44x in FY25 and is around 3.16x on a TTM basis (as of Dec 2025), indicating a high leverage. While it has shown some reduction, this remains a key risk factor for a holding company whose cash flows are largely dependent on dividend streams from subsidiaries. The Q3 FY26 results show continued strong operational performance, with revenue and net profit growing significantly year-on-year.
What the Market Is Missing
The market, in its enthusiasm for TVS Holdings' dividend yield and strong recent consolidated results, may be overlooking several nuanced risks inherent in its holding company structure and the underlying businesses. Firstly, the 'sum-of-the-parts' valuation, often applied to holding companies, can be volatile. While TVS Motor Company's robust performance is a clear positive, the market might not be fully discounting the potential for cyclical downturns in the two-wheeler segment, especially with increasing competition from new entrants and the rapid shift towards electric vehicles requiring substantial R&D and capital expenditure. The long-term profitability and market leadership of TVS Motor are not guaranteed and depend on successful navigation of this transition. Secondly, the financial services arm, TVS Credit Services, while growing, operates in a segment prone to asset quality risks. While Q3 FY26 results for TVS Credit were strong, Care Ratings noted a slight moderation in asset quality (Gross Stage 3 and Net Stage 3) in H1 FY26, particularly in the tractor and used commercial vehicle segments. An economic slowdown or rising interest rates could exacerbate these asset quality concerns, impacting TVS Credit's profitability and its ability to contribute dividends to the parent. Investors might be underestimating the potential for these 'hidden' risks within the diversified portfolio. Thirdly, the high debt-to-equity ratio of TVS Holdings itself, standing at approximately 3.16x, means that a significant portion of its earnings could be diverted towards servicing debt, potentially impacting the sustainability or growth of future dividend payouts, especially if interest rates rise or subsidiary performance falters. The market often assumes a smooth flow of dividends from subsidiaries to the parent, but regulatory or strategic decisions by the subsidiaries could alter this. The recent interim dividend, while positive, needs to be viewed in the context of the overall capital allocation strategy and the inherent volatility of its core investments.
Valuation and Expectations
Metric | TVS Holdings (TTM) | Industry Average |
|---|---|---|
| P/E Ratio (x) | 18.2 - 18.5 | 36.77 |
| P/B Ratio (x) | 5.16 | 5.22 |
| EV/EBITDA (x) | 61.53 | N/A |
| Dividend Yield (%) | 0.66 | 0.75 |
TVS Holdings' TTM P/E ratio, ranging between 18.2 and 18.5, appears significantly lower than the broader industry average of 36.77 (for auto parts/financial services composite). This suggests that the market might be applying a holding company discount or that its consolidated earnings are not fully comparable to pure-play operating companies. The P/B ratio of 5.16x is broadly in line with the industry average of 5.22x, indicating that the market values its assets at a similar multiple to peers. However, the EV/EBITDA of 61.53x appears quite high, suggesting that the market is pricing in significant future growth or that the company's EBITDA is relatively small compared to its enterprise value, possibly due to the holding company structure. The dividend yield of 0.66% is slightly below the industry average of 0.75%. The current valuation seems to price in continued strong performance from its key subsidiaries, particularly TVS Motor's growth in both traditional and EV segments, and TVS Credit's expansion. Any deceleration in the growth trajectory of these core businesses, or an increase in the holding company discount due to perceived risks or capital allocation concerns, could lead to a re-rating of the stock. The market expects a sustained dividend payout, which requires consistent profitability and healthy cash flows from its underlying businesses.
Bull, Base, and Bear Scenarios
Scenario | Key Assumptions | Potential Impact on TVS Holdings (12-18 months) |
|---|---|---|
| Bull Case | TVS Motor captures significant EV market share; TVS Credit asset quality remains strong with robust loan growth; Favorable auto cycle and consumer spending. | Share price appreciation of 20-30%; sustained or increased dividend payouts; P/E multiple expansion as holding company discount narrows. |
| Base Case | TVS Motor maintains steady growth in traditional and moderate EV adoption; TVS Credit continues loan book expansion with minor asset quality fluctuations; Stable economic environment. | Share price appreciation of 10-15%; consistent dividend payouts in line with historical trends; current valuation multiples largely sustained. |
| Bear Case | Sharp downturn in auto sector (domestic/global); intense competition in EVs impacting TVS Motor's margins; significant deterioration in TVS Credit's asset quality due to economic stress; rising interest rates increase debt servicing costs. | Share price decline of 15-25%; potential reduction or stagnation of dividend payouts; P/E multiple contraction as risks materialize and holding company discount widens. |
The probability-weighted outcomes for TVS Holdings largely hinge on the performance of its two main pillars: TVS Motor and TVS Credit. In a Bull Case, a confluence of successful EV transition for TVS Motor and robust, high-quality growth from TVS Credit could lead to a significant re-rating, as the market rewards diversified growth and improved capital efficiency. The probability of this is moderate, given the competitive nature of both sectors. The Base Case assumes a continuation of the current growth trajectory, where both subsidiaries perform reasonably well, supporting stable dividend flows. This scenario is assigned a higher probability, reflecting the established market positions of the TVS Group entities. However, the Bear Case, driven by macro-economic headwinds, intense competition, or a sharp decline in asset quality for TVS Credit, poses a substantial downside. Given the high leverage at the holding company level, any significant stress on subsidiary cash flows could amplify the negative impact on TVS Holdings. Investors must weigh these scenarios carefully, especially considering the inherent cyclicality of the auto sector and the credit risk in financial services.
Key Risks and Thesis Breakers
Peer Comparison
Company | Market Cap (Rs crore) | P/E (x) | P/B (x) | Dividend Yield (%) | ROCE (%) |
|---|---|---|---|---|---|
| TVS Holdings | 28,507 | 18.2 | 5.16 | 0.66 | 20.5 |
| Bajaj Holdings & Inv. | 75,000 (Approx) | 16.5 | 0.8 | 1.2 | 12.0 |
| JSW Holdings | 10,500 (Approx) | 10.2 | 0.9 | 0.5 | 8.5 |
| Sundaram Finance Hldgs | 5,200 (Approx) | 15.0 | 1.1 | 1.0 | 10.0 |
Comparing TVS Holdings with other Indian holding companies reveals interesting dynamics. While TVS Holdings' P/E ratio of 18.2x is slightly higher than some peers like Bajaj Holdings & Investment and JSW Holdings, it is important to consider the underlying assets. TVS Holdings' significant stake in TVS Motor, a high-growth operating entity, often commands a premium compared to holding companies with more passive or diverse, less dynamic portfolios. Its ROCE of 20.5% is notably higher than the peer group, suggesting more efficient capital deployment within its consolidated operations. However, its P/B ratio of 5.16x is significantly higher than most pure-play holding companies, which often trade at a discount to their book value or sum-of-parts. This could imply that the market is already assigning a premium to TVS Holdings, potentially anticipating continued strong growth from its subsidiaries, or that its book value calculation is different from peers. The relatively lower dividend yield compared to Bajaj Holdings might reflect a higher reinvestment rate in growth opportunities within its operating companies. The insight here is that TVS Holdings' valuation premium or discount is less about its holding company structure and more about the perceived growth potential and operational efficiency of its core operating assets, particularly TVS Motor and TVS Credit, within their respective competitive landscapes.
Who Should and Should Not Consider This Stock
Suitable For
- Long-term investors seeking exposure to the Indian auto and financial services sectors through a diversified holding company, willing to accept the inherent volatility.
- Investors who believe in the long-term growth story of TVS Motor Company's expansion into EVs and TVS Credit's continued penetration in retail finance.
- Those who prioritize capital appreciation potential driven by subsidiary performance over immediate high dividend yields.
Not Suitable For
- Short-term traders or investors seeking quick capital gains, given the holding company discount dynamics and cyclical nature of underlying businesses.
- Conservative investors averse to high debt-to-equity ratios and the risks associated with a diversified portfolio's inherent complexities.
- Income-focused investors solely relying on high and consistent dividend payouts, as these are contingent on subsidiary performance and capital allocation policies.
What to Track Going Forward
Final Take
TVS Holdings presents a unique investment proposition as a holding company offering diversified exposure to India's dynamic automotive and financial services sectors. The recent interim dividend declaration underscores the robust performance of its key subsidiaries, particularly TVS Motor Company, which continues to demonstrate strong growth and strategic moves into electric vehicles. However, investors must look beyond the immediate optimism and critically assess the sustainability of these returns. The underlying businesses operate in highly competitive and cyclical environments, with TVS Motor facing the challenges of EV transition and TVS Credit navigating potential asset quality risks in its lending portfolio. The holding company itself carries a relatively high debt-to-equity ratio, which, while managed, could become a pinch point if subsidiary performance falters or interest rates rise. The market appears to be pricing in continued strong growth, and any deviation from this trajectory, or an increase in the inherent holding company discount, could impact valuation. Long-term investors who understand these complexities and believe in the strategic direction and execution capabilities of the TVS Group may find value. However, a vigilant approach, focusing on the core operational metrics of its subsidiaries, asset quality trends in financial services, and the holding company's capital structure, will be crucial to navigate the risks and realize potential returns.
Frequently Asked Questions
What is TVS Holdings' primary business, and how does the recent dividend relate to it?
TVS Holdings is a Core Investment Company (CIC) with significant stakes in TVS Motor Company (automotive manufacturing) and TVS Credit Services (financial services). The recent interim dividend of ₹86 per share for FY26 is a distribution of profits, largely supported by the strong performance of its underlying subsidiaries, particularly TVS Motor Company, which also declared a significant interim dividend.
What are the key risks to TVS Holdings' valuation, especially considering its holding company structure?
The valuation of TVS Holdings, as a holding company, is inherently tied to the performance and valuation of its key subsidiaries. Risks include potential discounts applied to holding companies, cyclical downturns in the automotive sector impacting TVS Motor, and asset quality challenges or increased competition within the financial services sector affecting TVS Credit. Additionally, the high debt-to-equity ratio of the holding company itself warrants close monitoring.
References
- [1] TVS Holdings Ltd share price | About TVS Holdings | Key Insights - Screener. View Source ↗(Accessed: 2026-03-26)
- [2] TVS Holdings Ltd. Share Price Today, Market Cap, Price Chart, Balance Sheet - Finology Ticker. View Source ↗(Accessed: 2026-03-26)
- [3] TVS Group company declares an interim dividend of ₹86 per share. Record date, other details here | Stock Market News - Mint. View Source ↗(Accessed: 2026-03-26)
- [4] Dividend alert! TVS Holdings announces Rs 86 interim dividend; check record date - Zee Business. View Source ↗(Accessed: 2026-03-26)
- [5] TVS Holdings 2026 Company Profile: Stock Performance & Earnings - PitchBook. View Source ↗(Accessed: 2026-03-26)
- [6] TVS Holdings Share Price Today - Tvs Holdings Stock Price Live NSE/BSE - Groww. View Source ↗(Accessed: 2026-03-26)
- [7] TVS Holdings announces ₹86 per share dividend, sets record date; Sanofi India fixes record date; check details - Upstox. View Source ↗(Accessed: 2026-03-26)
- [8] TVS Holdings Share Price Gains Over 2%; Announces Interim Dividend of ₹86 Per Share; Record Date Set for April 2, 2026 - Angel One. View Source ↗(Accessed: 2026-03-26)
- [9] TVS Holdings declares Rs 86 interim dividend for FY26 — Record date set for April 2 - Moneycontrol. View Source ↗(Accessed: 2026-03-26)
- [10] TVS Credit registers growth of 17% in disbursement and 28% in PAT; reports PAT of Rs 385 crore for the half year ended September 2025 - TVS Credit Services. View Source ↗(Accessed: 2026-03-26)
- [11] TVS Credit registers growth of 21% in disbursement and 22% in PAT; reports PAT of Rs. 658 crore for the nine months ended December 2025 - TVS Credit Services. View Source ↗(Accessed: 2026-03-26)
- [12] TVS Holdings (BOM:520056) Market Cap & Net Worth - Stock Analysis. View Source ↗(Accessed: 2026-03-26)
- [13] TVS Credit registers 12% growth in disbursement and 29% growth in PAT, reports PAT of Rs 181 crore for the quarter ended June 2025 - TVS Credit Services. View Source ↗(Accessed: 2026-03-26)
- [14] TVSHLTD Share Price Today: TVS Holdings Stock Price NSE - Tickertape - Tickertape. View Source ↗(Accessed: 2026-03-26)
- [15] TVS Holdings - Quarterly Results and Financial Statement as of Dec, 2025 - Trendlyne. View Source ↗(Accessed: 2026-03-26)
- [16] Tvs Holdings Limited Today Live NSE/BSE - Bajaj Finserv. View Source ↗(Accessed: 2026-03-26)
- [17] TVS Holdings Share Price, Forecast & Financials (NSI:TVSHLTD) - Stockopedia. View Source ↗(Accessed: 2026-03-26)
- [18] TVS Holdings Ltd Quarterly Results, 24 Mar 2026 - Business Standard. View Source ↗(Accessed: 2026-03-26)
- [19] Who are the peers of the TVS Holdings? - Marketsmojo. View Source ↗(Accessed: 2026-03-26)
- [20] TVS Holdings Limited Reports Earnings Results for the Third Quarter and Nine Months Ended December 31, 2025 - MarketScreener. View Source ↗(Accessed: 2026-03-26)
- [21] TVS Holdings (TVSH) Financial Summary - Investing.com - Investing.com. View Source ↗(Accessed: 2026-03-26)
- [22] TVS Holdings Ltd Preferred Stock Price Today | NSE: TVSH_p Live - Investing.com. View Source ↗(Accessed: 2026-03-26)
- [23] TVS Holdings jumps on strong Q3 earnings - JM Financial Services - JM Financial Services. View Source ↗(Accessed: 2026-03-26)
- [24] TVS Credit's Competitors, Revenue, Number of Employees, Funding, Acquisitions & News - Owler. View Source ↗(Accessed: 2026-03-26)
- [25] TVS Motor Dividend 2026: Board Approves ₹12 Per Share Payout | Market News & Analysis - Times Now. View Source ↗(Accessed: 2026-03-26)
- [26] TVS Holdings Ltd Q3 Results & Revenue - INDmoney - INDmoney. View Source ↗(Accessed: 2026-03-26)
- [27] TVS Credit Services Limited - Care Ratings - Care Ratings. View Source ↗(Accessed: 2026-03-26)
- [28] TVS Motor Company (TVSM) Earnings Date & Report - Investing.com - Investing.com. View Source ↗(Accessed: 2026-03-26)
- [29] Financial Reports and Investor Information by TVS Motor - TVS Motor Company. View Source ↗(Accessed: 2026-03-26)
- [30] TVS Holdings Ltd Peer Comparison & Competitor Analysis | Kotak Neo - Kotak Neo. View Source ↗(Accessed: 2026-03-26)
- [31] TVS Holdings Board to Decide FY26 Interim Dividend March 25 | Whalesbook - Whalesbook. View Source ↗(Accessed: 2026-03-26)
- [32] TVS Motor Declares Interim Dividend FY 2025–26 at 1200%, Record Date March 31 - EquityPandit. View Source ↗(Accessed: 2026-03-26)
- [33] TVS Holdings Peer Comparison & Competitor Insights - Choice India - Choice India. View Source ↗(Accessed: 2026-03-26)
- [34] Quarter Ended 30th June 2025 - TVS Holdings Limited - TVS Holdings Limited (BSE Filing). View Source ↗(Accessed: 2026-03-26)
- [35] Return on Capital Employed (ROCE) of TVS HOLDINGS -Mar2025 - Smart-Investing.in. View Source ↗(Accessed: 2026-03-26)
- [36] TVS Holdings (NSEI:TVSHLTD) - Earnings & Revenue Performance - Simply Wall St. View Source ↗(Accessed: 2026-03-26)
- [37] TVS Holdings (520056) Balance Sheet & Financial Health Metrics - Simply Wall St. View Source ↗(Accessed: 2026-03-26)
- [38] TVS Holdings Ltd share price | About TVS Holdings | Key Insights - Screener. View Source ↗(Accessed: 2026-03-26)
Disclaimer: IMPORTANT DISCLAIMER: This analysis is generated using artificial intelligence and is NOT a recommendation to purchase, sell, or hold any stock. This analysis is for informational and educational purposes only. Past performance does not guarantee future results. Please consult with a qualified financial advisor before making any investment decisions. The author and platform are not responsible for any investment losses.
Continue Your Investment Journey
Discover more insights that match your interests

Max Healthcare Institute: Can Premium Healthcare Demand Offset Valuation Concerns Amidst Expansion?
Max Healthcare Institute Ltd.
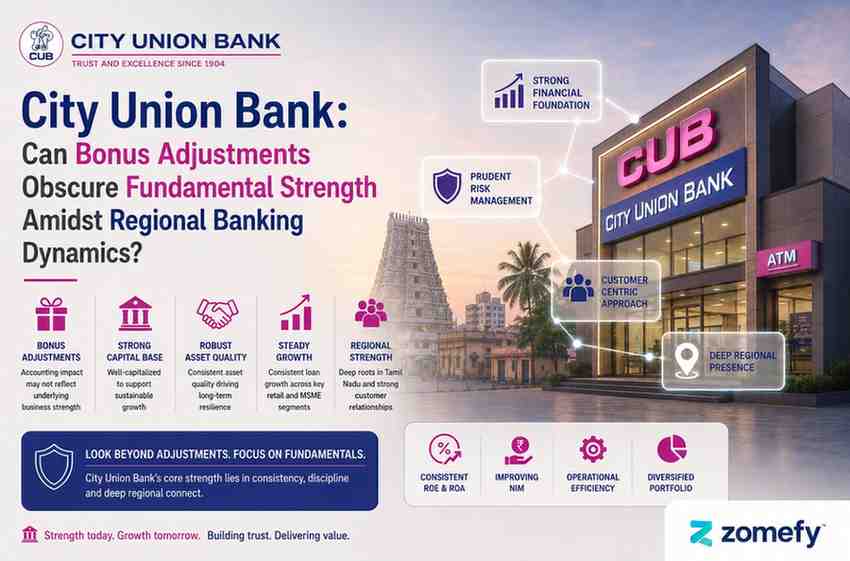
City Union Bank: Can Bonus Adjustments Obscure Fundamental Strength Amidst Regional Banking Dynamics
City Union Bank (CUB), one of India's oldest private sector lenders, often flies under the radar of mainstream equity research, yet it holds a significant position within the regional banking lands...

Gujarat Fluorochemicals: Can NOC for Composite Scheme Drive Sustainable Value Creation Amidst Sectoral Head
Gujarat Fluorochemicals (GFL) has long been a significant player in India's specialty chemicals landscape, leveraging its deep expertise in fluorine chemistry.
India's Market Breadth Crisis 2025: Why Benchmark Gains Are Masking Widespread Stock Weakness for Retail Investors
India's stock market presents a paradoxical picture in 2025: while benchmark indices like the Sensex and Nifty50 have reached all-time highs, the underlying market structure reveals a deeply concer...
Explore More Insights
Continue your financial education journey